Genetic diversity analysis in tropical maize germplasm for stem borer and storage pest resistance using molecular markers and phenotypic traits 
2. Chuka University, P.O. Box 109-60400, Chuka, Kenya
3. International Maize and Wheat Improvement Center (CIMMYT), P. O. Box 1041, 00621, Nairobi, Kenya
4. International Crops Research Institute for the Semi-Arid Tropics (ICRISAT), P. O. Box 1096, Lilongwe, Malawi, Kenya
 Author
  Correspondence author
Molecular Plant Breeding, 2015, Vol. 6, No. 17 doi: 10.5376/mpb.2015.06.0017
Received: 07 Jul., 2015 Accepted: 11 Aug., 2015 Published: 16 Oct., 2015
Mwololo J.K., Munyiri S.W., Semagn K., Mugo S. and Okori p., 2015, Genetic Diversity Analysis in Tropical Maize Germplasm for Stem Borer and Storage Pest Resistance using Molecular Markers and Phenotypic traits, Molecular Plant Breeding, 6(17) 1-22(doi: 10.5376/mpb.2015.06.0017)
One hundred maize inbred lines and eighty four hybrids were characterized for resistance to maize stem borer and post-harvest insect pests. This was achieved using genetic distance and population structure based on simple sequence repeat (SSR) markers and biophysical traits. The test materials were evaluated for stem borer, maize weevil and larger grain borer (LGB) resistance. Leaf samples were harvested from 10 healthy plants per genotype and bulked. Genomic DNA was extracted using a modified version of mini-prep Cetyl Trimethyl Ammonium Bromide (CTAB) method. The samples were genotyped with 55 SSRs makers. Univariate analysis of variance was done using the general linear model procedure of SAS statistical package. Rodgers genetic distance was calculated for all data sets as a measure of genetic distance using NTSYS-pc for Windows. The distance matrices were used to generate phenograms using the unweighted pair group method based on arithmetic average (UPGMA) method in MEGA5. The genotypes were assigned into different populations using population structure software. The data was further subjected to discriminant and principal component analysis to group the gnotyoes. Analysis of molecular variance within and among the different populations was done using arlequin. There were significant differences (P ≤ 0.001) for all the biophysical traits evaluated. The SSR marker data estimated successfully the close relationship among different hybrids and inbred lines within clusters. Comparisons of the different multivariate analyses revealed high concordance among the different approaches of analyses. The results of this study can be directly used by breeding programs to develop resistant genotypes.
Introduction
Maize is a staple food for more than 300 million people in sub Saharan Africa (SSA) and is commonly grown by small-scale and resource poor farmers in rural areas (Shiferaw et al., 2011). However, the average maize yield in SSA was estimated at 1.4 t/ha, which is extremely low as compared to the 3.3 t/ha reported in developing countries in other parts of the world, the 4.9 t/ha worldwide production and the 8.4 t/ha in industrialized countries. Several factors, including a wide range of pests and diseases, periodic drought, scarcity of irrigation water, low soil fertility and farmers inability to use farm inputs contribute to low productivity in SSA. Insect pest in the field and in storage are among the factors that reduce yields and food availability in the region. Maize stem borers cause maize losses of up to 15% in susceptible germplasm in the infested ecologies, while the storage pest, such as maize weevil and larger grain borer (LGB) cause 20-30% yield loss (http://www.syngentafoundation.org). Although there are different possible methods that help in minimizing yield loss by insect pest (e.g. chemical, biological and cultural methods), host plant resistance developed through breeding is a preferred method to disseminate improved maize varieties due to its environmental and human safety, relatively low cost, and ease of use by farmers. However, there is very little effort in breeding for insect pest resistance in SSA which may be due to the genetic and logistical challenges associated with insect pest and hosts (screening and selecting for insect resistance). Nevertheless, CIMMYT and partners have developed various multiple borer resistance (MBR) lines and population using conventional breeding methods under artificial infestation. Some of the MBR germplasm have been released and disseminated in some countries.
Assessment of genetic relationship and population structure is an important tool that underpins successful breeding programs (Mohammadi and Prasanna, 2003; Mukhtar et al., 2002). Genetic distance is a measure of genetic divergence between species or between populations within a species. Smaller genetic distances indicate a close genetic relationship whereas large genetic distances indicate a more distant genetic relationship. In a breeding program, genetic gain achieved through artificial selection is proportional to the extent of genetic differences present in the parental lines or populations. Thus, the correct choice of parents can influence the outcome of selection (Bohn et al., 1999). Depending on the objectives of a breeding programme, breeders use different methods in selecting the best parental combinations, including (a) pedigree relationships, (b) morphological and agronomic traits, (c) adaptability and yield stability, and (d) genetic distances estimated from morphological and molecular markers (Bohn et al. 1999; Maric et al., 2004; Bertan et al., 2007). Morphological and agronomic traits were the earliest genetic markers used in germplasm characterization and quantifying genetic distance in crops but they have a number of limitations including low polymorphism, low heritability, late expression during the development process and are highly influenced by the environment (Smith and Smith 1989).
In contrast, molecular markers, are more effective than morphological and agronomic traits for germplasm characterization. Genetic distance and population structure can be estimated from various types of molecular markers, including restriction fragment length polymorphism (RFLP), amplified fragment length polymorphism (AFLP), random polymorphic DNA (RAPD), microsatellites or simple sequence repeats (SSRs) and single nucleotide polymorphisms (SNPs). SSR makers are widely used by maize researchers because they are available in large numbers in the public domain (MaizeGDB: http://www.maizegdb.org), co-dominant, multiallelic, highly polymorphic even in closely related individuals, can be exchanged between laboratories, and have uniform distribution in the genome (Gupta et al., 2002; Prasanna et al., 2010). Although advances in marker technology have shifted toward SNP markers, particularly for model organisms with substantial genomic resources, SSRs markers perform better at clustering germplasm into populations and providing more resolution in measuring genetic distance than SNPs markers (Hamblin et al., 2007).
Genetic variability for resistance to field and postharvest insect pests using phenotypic data have been reported (Munyiri et al., 2010; Tefera, 2012). However, the extent of genetic differences and patterns of relationships among this germplasm and its response to stem borer, weevil and LGB resistance has not been well studied. The objective of this study was therefore to understand the extent of genetic difference, relationship and population structure across a subset of tropical maize germplasm that has been bred for field and storage pests’ resistance using SSR markers and biophysical traits.
1 Results
1.1 Phenotypic evaluation
There were significant differences (P ≤ 0.001) among the maize inbred lines and hybrids for all the biophysical and bioassay traits measured in the study. These traits were used to group the maize germplasm into resistant and susceptible.
1.2 Genetic distance and relationship
Roger’s genetic distance between pairwise comparisons of all the 184 genotypes ranged from 0.004 to 0.467, and the overall average distance was 0.302. The vast majority (92.4 %) fell between 0.200 and 0.400 (Figure 1).
.png)
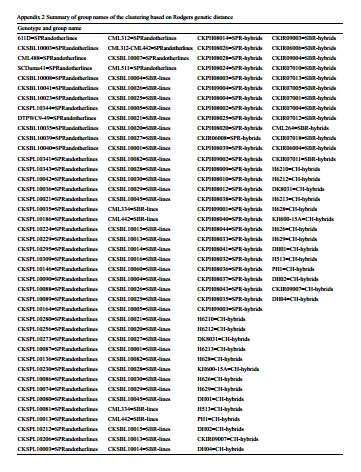
The UPGMA tree generated from Roger’s genetic distance matrix grouped the majority of the genotypes into two major groups, one for inbred lines and the other for hybrids (Figure 2). The first group had three sub-groups (NA, G1 and G2) while the second group had also three sub-groups G3, G4 AND G5. Sub-group one (G1) consisted of a total of 68 inbred lines, including 29 lines that are resistant both for storage pests and stem borers, 23 lines that are resistant only to storage pests, 14 lines that are resistant only to stem borers, and 2 lines that are susceptible to both storage and field pests.
.png) Figure 2 UPGMA tree for 100 inbred lines and 84 hybrids based on Roger’s genetic distance calculated from 227 SSR alleles. The different groups are indicated with different colours, and detail group membership is provided in appendix 1 |
Sub-group 2 (G2) consisted of inbred lines which have been bred for both stem borer and storage insect pests (9 lines), stem borer resistance (15 lines) and yield (2 lines).
In the second group which was composed of hybrids, Sub-group 3 (G3) consisted of hybrids which had been bred for storage pest resistance (23 hybrids), stem borers (10 hybrids) and grain yield (5 hybrids).
Group 4 (G4) was composed of 13 commercial hybrids from different seed companies which were all susceptible to the storage insect, and only 4 of the 13 hybrids showed some levels of resistance to the stem borer.
Group five (G5) consisted of 25 hybrids that were resistant to stem borer and two hybrids resistant to both stem borer and the storage insect pests.
The first five principal components from principal component analysis explained 25.7% of the total SSR variations among samples. A plot of PC1 (8.8%) and PC2 (7.4%) revealed 3 major groups (Figure 3) and the pattern of grouping was the same as for the model-based population partition at k=3.
.png) Figure 3 Principal component analysis (PCA) of 184 genotypes based on 56 SSRs. The groups from PCA supports the presence of population structure at K=3. Individuals that were assigned in to a mixed group in the population structure analysis are indicated in circle (red colour) |
1.3 The population structure based on SSRs
The estimated log probability of the data (LnP(D)) increased sharply between K = 1 and K = 4 (Figure 4b), and fairly stabilized between K = 5 and K = 6 (Figure 4a). The ad hoc statistic ΔK showed a higher likelihood values at K = 3 (Figure 4b), with a sharp decrease when K increased from 3 to 6 (Figure 4a). Therefore the estimated LnP (D) and K both suggest the presence of 3 possible groups.
.png) Figure 4 Population structure of 184 genotypes based on 227 alleles from 56 SSR markers: a) Plot of LnP (D) and ∆K calculated for K ranging between 1 and 6, with each K represented by a mean of 3 repeats b) Population structure of the 184 genotypes at K =3 and K =4. Each individual is represented by a single vertical line that is partitioned into K coloured segments, with lengths proportional to the estimated probability membership to each of the K inferred clusters |
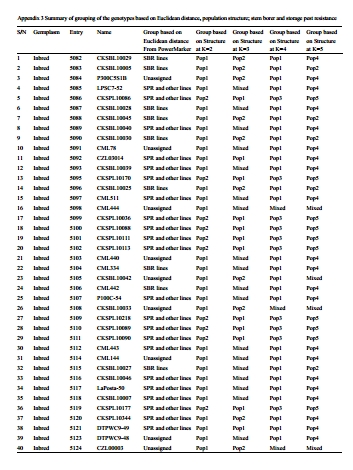
Assignment of genotypes into specific groups was irrespective of the type of germplasm (inbred versus hybrids) and generally followed their pedigree information and their reaction to field and storage pests, with overlapping variation with some other traits, such as grain yield and drought tolerance. The majority of the genotypes were assigned to group 2, which included 23 hybrids (CKIR series) and 15 inbred lines (CKSB series) bred for stem borer resistance, 18 commercial hybrids and other inbred lines from the CIMMYT breeding programs. Group 1 and 3 consisted of 41 inbred lines in CKSP series and 28 hybrids in CKPH series that were bred for storage pest resistance within the CIMMYT breeding program. The mixed population generally was made up of CIMMYT inbred lines bred for yield and drought tolerance.
1.4 Discriminant analysis
The reliability of the different groups obtained through the model-based population structure and cluster analyses was assessed through discriminant analyses using the group membership from both methods as categorical variables. The discrimination model with the stepwise procedure identified 12 alleles from 11 SSRs as the best explanatory variables for the priori group defined at K = 3 and 22 alleles from 21 SSRs for the prior groups obtained using cluster analysis (Table 1 and 2 shows the list of SSR alleles that were chosen by the stepwise discriminant analyses). The Mahalanobis distance matrix from pairwise comparisons of the 3 groups obtained from STRUCTURE at K=3 ranged from 4.0 to 37.0 and they were all significant, with group 3 being 2 to 11 times more distant from all others.
.jpg) Table 1 List of SSR alleles that were chosen by the stepwise discriminant analyses for groups at K=3 |
.jpg) Table 2 List of SSR alleles that were chosen by the stepwise discriminant analyses for groups from cluster analysis |
The Mahalanobis distance between groups obtained using cluster analysis ranged from 9.84 to 83.4. The commercial hybrids (CHS) were generally more distant from all the other genotypes. Based on the population structure, the grouping at K=3 corresponds to the clustering based on the Rodgers genetic distance since population 1 was equivalent to the SPRL, population two constituted the SBRL and SBRH which were close to one another with a distance of 9.84 between them, and the commercial hybrids (G4 in the dendrogram), population 3 to SPRH and the mixed population constituted other CIMMYT lines bred for yield and drought. The phenotypic traits for classifying the genotypes into resistance and susceptible was not a good indicator for discriminating the genotypes, since the canonical correlation coefficient (CAN1) was 0.13 and 0.26 for the stem borer and storage pest resistance indices respectively.
Comparisons of the different multivariate analyses revealed high concordance among the PCA, model-based population partition, clustering based on the genetic distance and discriminant analyses in terms of the number of groups and members in each group. However, there was low concordance between grouping based on the phenotypic data indices and the SSR based population partitioning in assigning the genotypes into the different groups or populations.
1.5 Analysis of molecular variance (AMOVA)
Table 3 shows the partitioning of the overall SSR variance into hierarchical levels using AMOVA. When AMOVA was performed using the 6 possible groups predicted from UPGMA-cluster analyses and population structure; and the two groups based on storage pest resistance, the estimated fixation indices (FST) varied from 6.49 % to 27.85%. When the overall SSR variance was partitioned into hierarchical levels using the groups predefined from the model-based population partition at K = 2, K = 3, K = 4, K = 5 and K = 6 as categorical variables, FST accounted for 15.3%, 23.8%, 25.86%, 26.56% and 27.85%, respectively. In the cluster analysis that based on the storage pest resistance trait, FST accounted for 24.26% and 6.49% respectively. A random permutation test indicated that the proportion of variances attributable at all groups were highly significant (p < 0.0001).
.jpg) Table 3 Analysis of molecular variance (AMOVA) for the extraction of SSR variation among groups (populations) and among individuals within populations |
2 Discussion
The significant differences and wide range in the means of the phenotypic traits related to resistance among the germplasm shows that there is great potential for the development of improved maize genotypes that are resistant to the postharvest insect pests. The biophysical/bioassay and molecular data confirm the existence of genetic divergence in tropical maize germplasm in response to the maize field and storage insect pests. This is in agreement with earlier studies that reported the existence of genetic variability of resistance to the maize weevil, larger grain borer and the stem borers among tropical maize germplasm (Arnason et al., 1994; Mwololo et al., 2010; Tefera et al., 2011). This genetic diversity can be exploited in breeding programs to introgress resistance to field and postharvest insect pests into improved varieties using conventional and genetic engineering approaches (Dhliwayo and Pixley 2003).
Overall mean Roger’s genetic distance of 0.353 among pairwise comparisons of inbred lines, with the vast majority (94.2 %) showing distances between 0.300 and 0.400 have been reported (Semagn et al., 2012). This slightly differs from the average distance (0.3012) obtained from the current study. The observed lower genetic distance is likely due to the mixed origin of the inbred lines and hybrids. Clustering of the individual candidates among the wide germplasm evaluated in relation to resistance to the maize stem borer and postharvest insect pests was evident. Some of the genotypes which had been bred for stem borer and storage insect pests were resistant to both classes of maize insects hence has the potential to breed for multiple resistance. In addition, the clustering based on the SSR marker conforms to the history of generating the different genotypes. The grouping based on the phenotypic traits did not show a clear genetic differentiation with regard to specific resistance traits of the six different groups from the cluster analysis based on the SSR marker data. This is in agreement with previous studies whereby there was lack of clear clustering patterns based on phenotypes, environmental adaptation and grain colour (Xia et al., 2005). This can be explained by the fact that, selectively neutral markers used were not subject to selection and thus resistance, an adaptive trait had low correlation with SSR data (Koebner et al., 2002). The molecular analysis provides a wider genome sampling than the phenotypic analysis, therefore it is able to give a clear picture of genetic distance. The variation detected by the molecular markers is non-adaptive, hence not affected by natural or artificial selection. Most desirable phenotypic traits in plant breeding are a result of interaction among expressed genes, but agronomic studies are still essential in germplasm description and determination of molecular genetic distance is a complement (Donini et al., 2000). Clear estimates of the genetic distances would be closer when there is association between the loci controlling the phenotypic trait of interest (QTL) and the markers used and when a larger number of the traits of interest in relation to a particular situation are evaluated (Roy et al., 2004; Lefebvre et al., 2001). Earlier studies have reported that it is necessary to consider the molecular and phenotypic data separately in genotype divergence studies (Warburton et al., 2002). The use of phenotypic traits is therefore, relatively less efficient in discrimination of closely related genotypes and analysis of their genetic relationships compared to the use of molecular markers. Nevertheless, the use of phenotypic traits serves as a general approach in germplasm classification within a collection in relation to a particular trait.
The multivariate analyses revealed high concordance among the PCA, model-based population partitioning, clustering based on the genetic distance and discriminant analyses in terms of the number of groups and members in each group. Earlier studies have shown that principal component analysis as well as population structure are good predictors of grouping patterns and they can be used to complement the clustering method analysis, since different combinations of genetic distance matrices and clustering algorithms can give rise to somewhat different groups (Reif et al., 2005; Semagn et al., 2012).
The FST values form the analysis of molecular variance indicates a moderate genetic differentiation among groups and or populations. This is in agreement with the results of genetic diversity studies from previous research on maize populations (Semagn et al., 2012; Wen et al., 2012). In addition it has been reported that most variation in maize populations is partitioned within, rather than between populations, because maize is an out-crossing species a factor that lead to reduced population differentiation (Hamrick and Godt 1997).
Genetic divergence for resistance to stem borer and postharvest insect pests exists in tropical maize germplasm.
Using the biophysical/bioassay traits which are adaptive, it was possible to discriminate the resistant from the susceptible but not according to their pedigree. The integrated analysis using SSR markers suggested that the maize germplasm was likely to be composed of four subpopulations (k = 3), one group of storage pest resistance lines, another group of stem borer resistance lines related to stem borer resistant hybrids, a third group of storage pest resistant hybrids and a fourth group constituting commercial hybrids from different seed companies within Kenya and a mixed group formed by the remaining genotypes. The grouping based on the SSR markers was highly consistent with the pedigree data. The results of this study can be directly used by breeding programs to better explore the genetic variability within the groups to develop new lines and between the groups to generate hybrids resistant to both field and postharvest insect pests in maize.
3 Materials and Methods
3.1 Evaluation for maize stem borer
A total of one hundred eighty four maize genotypes comprising of 100 inbred lines and 84 hybrids, from CIMMYT Kenya selected from CIMMYT Kenya breeding program was used in the study (Appendix 2). All the 184 genotypes and 36 checks (20 stem borer resistant and 16 susceptible checks) were evaluated for Chilo partellus and Busseola fusca resistance in October 2010 and April 2011 at the Kenyan agricultural research institute (KARI) stations both in Kiboko and Embu, Kenya. Kiboko is a dry and mid-altitude agro-ecological zone located at an elevation of 975 meters above sea level (masl), 37° 75´E and 2° 15´ S. it has a sandy clay soil with an average annual rainfall of 530 mm and a mean minimum and maximum temperature of 14.3 and 35.1℃, respectively. Embu is a moist and mid-altitude zone located at an elevation of 1350 masl, and 37º 42´ E and 0º 49´ S. Embu has a clay loam soil with an annual rainfall of 1,200 mm and a mean minimum and maximum temperature of 14.1 and 25℃, respectively.
Trials were planted in two-row plots of 5 m long at 0.25 m between hills and 0.75 m between rows using an alpha lattice design, with three replications per location. Two seeds were planted per hill and later thinned to one, giving a total plant density of 53,333 plants per hectare. In order to ensure a healthy crop, agronomic practices including weeding, fertilizer application and supplemental irrigation were done according to good agricultural practices. Each plot was divided into two equal parts, one section for 10 stem borer infested plants while the other portion of 10 plants was protected from stem borer damage by applying bulldock® 25 EC insecticide at a concentration of 25 g/l Beta-Cyfluthrin and acted as the control. Stem borer infestation was done approximately 3 weeks after planting by artificially infesting the 10 plants per plot with 5 first-instar neonates of C. partellus in Kiboko and B. fusca in Embu. The stem borers larvae used in this experiment were obtained from KARI-Katumani insectary. Leaf-damage for each individual plant was scored two weeks after infestation on a scale of 1 to 9 (1= no visible leaf damage; 9= plants dying as a result of leaf damage) (Tefera et al., 2011). At harvest, the numbers of exit holes on the stems were counted and the cumulative tunnel length was measured by splitting the stems. Ears from stem borer uninfested plots were harvested, sun-dried to a moisture content of 12-13 % and used for, maize weevil and larger grain borer evaluation at the KARI/CIMMYT Entomology Laboratory in Kiboko as described below.
3.2 Evaluation for maize weevil and larger grain borer
The maize grains were disinfested by fumigating with phostoxin tablets for seven days to eliminate field infestation. For each genotype 100 grams of grain from each plot per replication was placed in 250 ml jars, infested with 50 unsexed 7-10 day old maize weevils and larger grain borer separately, and stored for 90 days at a temperature of 26-28ºC and relative humidity of 70-75 %. The insects used in the experiment were obtained from the KARI/CIMMYT Kiboko maize Entomology Laboratory where they were reared on the grains of maize cultivar PH3253 under controlled conditions (28ºC and 75% relative humidity). Evaluation was conducted using a completely randomized design with 3 replications. The contents of each jar were sieved with mesh (Endecotts Ltd, UK1) 90 days after infestation to separate grains, insects and flour. The flour produced by the insects was weighed, while the number of damaged kernels and adult insect progeny were counted. The grain weight loss was computed by subtracting the final from the initial weight of the grain sample and expressed as a percentage (Tefera et al. 2011). Damaged kernels were separated from the undamaged based on grain tunnelling and holes. The percentage of damaged grain was computed. Finally, the weight of the damaged and undamaged grains was measured.
3.3 DNA extraction and genotyping
Leaf samples were harvested from 10 healthy plants per genotype about 3 weeks after sowing at the Kiboko station. They were sampled in perforated Ziploc bags, immediately transferred into a Styrofoam box containing dry ice and transported to the Biosciences for eastern and central Africa (BecA) hub in Nairobi. Approximately equal amount of leaf tissue from each of the 10 plants per genotype was bulked, cut into pieces, and transferred into 1.2 ml strip tubes that contained two 4-mm stainless steel grinding balls (Spex CetriPrep, USA). The leaf samples were freeze-dried for 4 days using a Labconco freeze dryer (http://www.labconco.com) as described in the user’s manual. The lyophilized leaf samples were ground into fine powder at 1500 strokes per minute for 2 minutes using GenoGrinder-2000 and genomic DNA was extracted using a modified version of the CIMMYT high throughput mini-prep Cetyl Trimethyl Ammonium Bromide (CTAB) method as described elsewhere (Semagn 2014). The quality of the isolated DNA was checked after running aliquots of DNA samples on a 0.8% agarose gel that contained 0.3 µg/mL Gel-Red-(Biotium). DNA concentration was measured using NanoDrop-ND-1000 Spectrophotometer, (Thermo Scientific, Wilmington, DE 19810, USA).
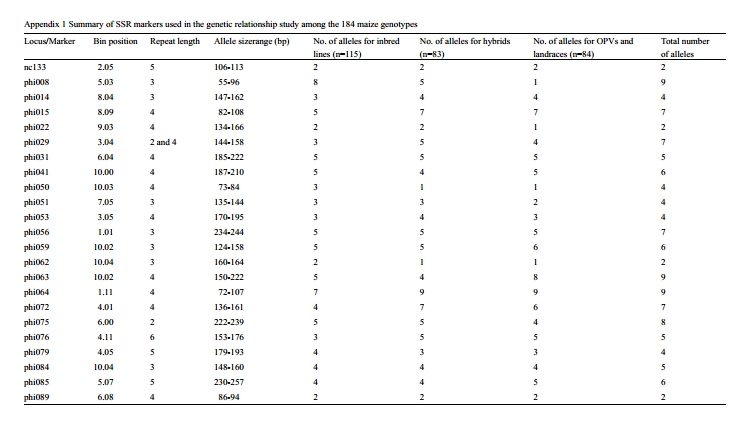
The samples were genotyped with 56 fluorescently- labelled SSRs (Appendix 1), selected from the list of markers used for the genetic characterization of CIMMYT maize inbred lines and OPVs (Warburton et al., 2002). Polymerase Chain Reaction (PCR), genotyping and data scoring were done as described in another paper (Semagn et al., 2014). Both DNA extraction and genotyping were done at the Biosciences Eastern and Central Africa (BecA) hub.
3.4 Analysis of phenotypic data
The percentage weight loss, flour weight and grain damage data were transformed using arcsine transformation to normalize its frequency distribution. A univariate analysis of variance using the general linear model (GLM) procedure of SAS version 9.3 (SAS Institute 2003) was performed on grain biophysical and insect bioassay traits as well as the stem borer damage traits. A susceptibility index based on leaf damage score, number of borer exit holes and cumulative tunnel length was computed by summing up the ratios between values and overall mean and dividing by the number of parameters evaluated. Germplasm with susceptibility-index values less than 0.8 were regarded as resistant, and those with greater than 0.8 as susceptible (Tefera et al. 2011).
3.5 Analysis of molecular data
SSR data analyses were conducted as described by Semagn et al., (2014). Briefly, AlleloBin (http://www. icrisat.org/bt-software-downloads.htm) was used for adjusting inconsistencies in allele calls obtained from GeneMapper software. The number of adjusted alleles per locus for each bulked genotype varied from 2 to 11. Thus, the adjusted allele sizes were converted into binary format (present =1 and absent = 0) using ALS-Binary(http://www.icrisat.org/bt-software-downloads.htm). Rogers distance matrix was calculated between each pair of genotypes using NTSYS-pc for Windows, version 2.0. The distance matrix was used to generate phenograms using the unweighted pair-group method based on arithmetic average (UPGMA) as implemented in MEGA5.1. Principal component analysis (PCA) was performed to project the genotypes into different groups using JMP version 7.0 (SAS institute Inc., Cary, NC, USA). The first two principal components were plotted to visualize patterns of relationships among genotypes. An admixture model-based clustering method implemented in the software package STRUCTURE version 2.3.3 (Pritchard et al., 2000) was used to infer population structure among genotypes. STRUCTURE was run by varying the number of clusters (k) from 1 to 6, with each K repeated thrice at a burn-in period of 100,000 and 100,000 MCMC (Markov Chain Monte Carlo) replications after burn-in. Genotypes with membership probabilities > 60% were assigned to the same group, while those with < 60% probability memberships in any single groups were assigned to a “mixed” group. A stepwise forward canonical discriminant analysis was run using SAS statistical package (SAS Institute 2003). Analysis of molecular variance (AMOVA) was used to partition the variation among and within groups using ARLEQUIN version 3.11. For both discriminant analysis and AMOVA, the genotypes were assigned into groups or populations using the results from the phenotypic data, STRUCTURE and cluster analysis (Appendix 3).
Authors’ contributions
All the authors participated in carrying out the experiments towards generation of data. S assisted in handling of the molecular data. JK, All the co-authors were involved in drafting the manuscript and reviewing it for quality check. K, S and P were the key supervisors of the research work as part of advisory team for PhD research work.
Acknowledgement
The financial support by the Regional Universities Forum for Capacity building in Agriculture (RUFORUM), International Maize and Wheat Improvement Center (CIMMYT) and the Syngenta Foundation for Sustainable Agriculture through the Insect Resistant Maize for Africa (IRMA) Project is gratefully acknowledged. Mr. Joel Mbithi, Andrew Chavangi, Mr. Patrick Gichobi, Mr. Charles Marangu, Mrs.Veronica Ogungo, the technical staff at KARI-Kiboko; and Mr. David Karuri, of KARI-Embu, are recognized for their efforts in assisting with the field trials and laboratory experiments.
References
Arnason J.T., Baum J., Gale J.D., Lambert R., Bergvinson D., Philogene B.J., Serratos J.A., Mihm J., and Jewell D.C., 1994, Variation in resistance of Mexican landraces of maize to maize weevil Sitophilus zeamais, in relation to taxonomic and biochemical parameters, Euphytica, 74: 227-236
http://dx.doi.org/10.1007/BF00040405
Bertan I., Carvalho F., and Oliveria A., 2007, Parental selection strategies in plant breeding programs, Journal of Crop Science and Biotechnology, 10: 211-222
Bohn M., Utz H., and Melchinger A., 1999, Genetic similarities among winter wheat cultivars determined on the basis of RFLPs, AFLPs, SSRs and their use for predicting progeny variance, Crop Science, 39: 228-237
http://dx.doi.org/10.2135/cropsci1999.0011183X003900010035x
Dhliwayo T., and Pixley K.V., 2003, Divergent selection for resistance to maize weevil in six maize populations, Crop Science, 43: 2043-2049
http://dx.doi.org/10.2135/cropsci2003.2043
Donini P., Law J., Koebner R., and Reeves J., 2000, Temporal trends in the diversity of UK wheat, Theoretical Applied Genetics, 100: 912-917
http://dx.doi.org/10.1007/s001220051370
Gupta P., Balyan H., Edwards K., Isaac P., Korzun V., Röder M., Gautier M.F., Joudrier P., Schlatter A., Dubcovsky J., De la Pena R., Khairallah M., Penner G., Hayden M., Sharp P., Keller B., Wang R., Hardouin J., Jack P., and Leroy P., 2002, Genetic mapping of 66 new microsatellite (SSR) loci in bread wheat, Theoretical and Applied Genetics, 105: 413-422
http://dx.doi.org/10.1007/s00122-002-0865-9
Hamblin M., Warburton M., and Buuckle E., 2007, Empirical comparison of simple sequence repeats and single nucleotide polymorphisms in assessment of maize diversity and relatedness, PloS One, 2: e1367
http://dx.doi.org/10.1371/journal.pone.0001367
Hamrick J.L., and Godt M.J.W., 1997, Allozyme diversity in cultivated crops, Crop Science, 37: 26-30
http://dx.doi.org/10.2135/cropsci1997.0011183X003700010004x
Koebner R., Donini P., Reeves J., Cooke, R., and Law, J., 2002. Temporal flux in the morphological and molecular diversity of UK barley, Theoretical Applied Genetics, 106, 550-558
Lefebvre V., Goffinet B., Chauvet J., Caromel B., Signoret P., and Brand R., 2000, Evaluation of genetic distances between pepper inbred lines for cultivar protection purposes: Comparison of AFLP, RAPD, and phenotypic data, Theoretical Applied Genetics, 102: 741-750
http://dx.doi.org/10.1007/s001220051705
Maric S., Bolaric S., Martincˇic J., Pejic´ I., and Kozumplik V., 2004, Genetic diversity of hexaploid wheat cultivars estimated by RAPD markers, morphological traits and coefficients of parentage, Plant Breeding, 123: 366-369
http://dx.doi.org/10.1111/j.1439-0523.2004.00956.x
Mohammadi S., and Prasanna B., 2003, Analysis of genetic diversity in crop plants-salient statistical tools and consideration, Crop Science, 43: 1235-1248
http://dx.doi.org/10.2135/cropsci2003.1235
Mukhtar M., Rahman M., and Zafar Y., 2002, Assessment of genetic diversity among wheat (Triticum aestivum L.) cultivars from a range of localities across Pakistan using random amplified polymorphic DNA (RAPD) analysis, Euphytica, 128: 417-425
http://dx.doi.org/10.1023/A:1021261811454
Munyiri S.W., Okori P., Mugo S.N., Otim M., Gibson P., and Mwololo J.K., 2010, Genetic diversity in maize landraces for resistance to Chilo partellus in Kenya, In: Second RUFORUM Biennial Conference proceedings held on 20- 24 September, 2010, Entebbe, Uganda, pp.1003-1007
Mwololo J.K., Mugo S., Okori P., Tefera T., and Munyiri S.W., 2010, Genetic diversity for resistance to larger grain borer in maize hybrids and open pollinated varieties in Kenya, Second RUFORUM Biennial Meeting, Kampala, Uganda, pp.535-539
Prasanna B., Pixley K., Warburton M., and Xie C.X., 2010, Molecular marker-assisted breeding options for maize improvement in Asia, Molecular Breeding, 26: 339-356
http://dx.doi.org/10.1007/s11032-009-9387-3
Pritchard J.K., Stephens M., and Donnelly P., 2000, Inference of population structure using multilocus genotype data, Genetics, 155: 945-959
Reif J.C., Melchinger A.E., and Frish M., 2005, Genetical and mathematical properties of similarity and dissimilarity coefficient applied in plant breeding and seed bank management, Crop Sci., 45: 1-7
http://dx.doi.org/10.2135/cropsci2005.0001
Roy J., Lakshmikumaran M., Balyan H., and Gupta P., 2004, AFLP-based genetic diversity and its comparison with diversity based on SSR, SAMPL, and phenotypic traits in bread wheat, Biochemical Genetics, 42: 43-59
http://dx.doi.org/10.1023/B:BIGI.0000012143.48298.71
SAS Institute, 2003, Statistical software system, Proceedings of the Twenty-Eighth Annual SAS® Users Group International Conference, Cary, NC, USA
Semagn K., 2014, Leaf tissue sampling and DNA extraction protocols. In: Besse P.(ed.), Molecular plant taxonomy: methods and protocols, Human Press, New York, pp.53-67
http://dx.doi.org/10.1007/978-1-62703-767-9_3
Semagn K., Magorokosho C., Ogugo V., Makumbi D., and Warburton M.L., 2014, Genetic relationships and structure among open-pollinated maize varieties adapted to eastern and southern Africa using microsatellite
markers, Molecular Breeding, pp.1-13
http://dx.doi.org/10.1007/s11032-013-9917-x
Semagn K., Magorokosho C., Vivek B.S., Makumbi D., Beyene Y., Mugo S., Prasanna B.M., and Warburton M.L., 2012, Molecular characterization of diverse CIMMYT maize inbred lines from eastern and southern Africa using single nucleotide polymorphic markers., BMC Genomics, 13:113. doi:10. 1186/1471-2164-13-113
Shiferaw B., Prasanna BM., Hellin J., and Bänziger M., 2011, Crops that feed the world, past successes and future challenges to the role played by maize in global food security, Food Security, 3: 307-327
http://dx.doi.org/10.1007/s12571-011-0140-5
Smith J., and Smith O., 1989, Comparison of heterosis among hybrids as a measure of relatedness with that to be expected on the basis of pedigree, Maize Genetics Cooperation News, 63: 86-87
Tefera T., 2012, Post-harvest losses in African maize in the face of increasing food shortage, Food security, 4: 267-277
Tefera T., Mugo S., Tende R., and Likhayo P., 2011, Methods of screening maize for resistance to stem borers and post-harvest insect pets, ISBN: 978-92-9059-289-1 ed, CIMMYT, Nairobi, Kenya
Warburton M., Skovmand B., and Mujeeb-Kazi, 2002, The molecular genetic characterization of the ‘Bobwhite’ bread wheat family using AFLPs and the effect of the T1BL.1RS translocation, Theoretical Applied Genetics 104: 868-873
http://dx.doi.org/10.1007/s00122-001-0816-x
Wen Y., John N., Eleazar E., and Eran H., 2012, A model-based approach for analysis of spatial structure in genetic data, Nature Genetics, 44: 725-732
http://dx.doi.org/10.1038/ng.2285
Xia X.C., Reif J.C., Melchinger A.E., Frisch M., Hoisington D.A., Beck D., Pixley K., and Warburton M.L., 2005, Genetic diversity among CIMMYT maize inbred lines investigated with SSR markers: II. Subtropical, tropical mid-latitude and highland maize inbred lines and their relationships with elite U.S. and European maize, Crop Science, 45: 2573-2582
http://dx.doi.org/10.2135/cropsci2005.0246
Gupta, Balyan, Edwards, Isaac, Korzun, Roder, Gautier, Joudrier, Schlatter, Dubcovsky, De L.P., Khairallah, Penner, Hayden, Sharp, Keller, Wang, Hardouin, Jack, and Leroy, 2002, Genetic mapping of 66 new microsatellite (SSR) loci in bread wheat, Theoretical and Applied Genetics, 105: 413-422
Prasanna B., Pixley K., Warburton M., and Xie C.X., 2010, Molecular marker-assisted breeding options for maize improvement in Asia, Molecular Breeding, 26: 339-356


. PDF(1268KB)
. FPDF
. HTML
. Online fPDF
Associated material
. Readers' comments
Other articles by authors
. Mwololo J.K.
. Munyiri S.W.
. Semagn K.
. Mugo S.
. Okori p.
Related articles
. Resistance
. Maize insect pests
. Genetic distance
. Breeding
. Molecular markers
Tools
. Email to a friend
. Post a comment