Assessment of Wheat Variety Uniformity using SSR Markers 
Rm 506, Bldg 1, #9 Shu Guang huayuan Zhong Lu, Haidian District, Beijing 100097, China
 Author
  Correspondence author
Molecular Plant Breeding, 2015, Vol. 6, No. 21 doi: 10.5376/mpb.2015.06.0021
Received: 20 Jul., 2015 Accepted: 22 Aug., 2015 Published: 10 Nov., 2015
Wang L.X., Pang B.SH., Liu L.H., Li H.B. and Zhao C.P., 2015, Assessment of Wheat Variety Uniformity using SSR Markers, Molecular Plant Breeding, 6(15) 1-21 (doi: 10.5376/mpb.2015.06.0021)
Assessment of uniformity is important for wheat (Triticum aestivum L.) variety registration and protection. However, the current testing system, which assesses a range of morphological characters, is time consuming (8-9 months for winter wheat), often is altered by environmental factors, and is not suitable for the assessment of hundreds of samples. The objective of this study was to develop a procedure for the assessment of wheat variety uniformity using simple sequence repeat (SSR) markers. Based on the studies of the relationship between the homozygous loci ratio of SSR markers (SSR-HLR) and variety uniformity, and detection of seed purity using SSR markers, we here propose that wheat variety uniformity is assessed on the basis of estimation of seed purity and the SSR-HLR. A variety is uniform if its seed purity and SSR-HLR are both > 95%. A variety with an SSR-HLR < 91% and/or seed purity ≤ 95% is not uniform. The varieties with an SSR-HLR ranging from 91% to 95% require additional uniformity assessments in the field because not all of them are uniform or not uniform. Those varieties make up less than 10% of the varieties (300-400) assessed in wheat regional trials annually in our laboratory, thus SSR markers are suitable for uniformity assessment of ~90% of wheat varieties. The procedures for uniformity assessment based on seed purity and SSR-HLR are detailed here. On average, it takes only seven days to assess one variety following the proposed procedure and greatly shortens the assessment cycle. SSR markers are not altered by environmental factors. Therefore, rapid and accurate assessment of a large batch of varieties becomes possible.
Introduction
The assessment of distinctness, uniformity, and stability (DUS) in wheat varieties is a statutory requirement before new varieties are registered and plant breeders' rights are granted in China as a member country of the International Union for the Protection of New Varieties of Plants. Uniformity assessment of a wheat variety involves evaluating whether there are significant differences in phenotypic and agronomic traits among individuals of a variety. The variety is considered uniform if the number of off-type individuals does not exceed a threshold value. On the basis of the national standard GB/T 19557.2-2004 entitled Guidelines for the conduct of tests for distinctness, uniformity and stability-Wheat (Triticum aestivum L.), issued in 2004, uniformity assessment requires the testing of 56 traits of at least 2000 plants of a variety over the course of one cropping season (8-9 months for winter wheat), and the variety is considered uniform if off-type plants comprise less than 2.5%. This method has several disadvantages, such as a long assessment period, phenotype-environment interactions, and the difficulty of distinguishing similar individuals. Therefore, rapid and accurate assessment of a large batch of varieties is impossible.
For development of a new assessment method, the feasibility of molecular markers for testing variety uniformity has been reported in corn, wheat, sugar beet, tomato, and rape (De Riek et al., 2001; Cooke et al., 2003; Wang et al., 2007; Lu et al., 2008; Wang et al., 2009b). However, most authors confuse the genotype of contaminant plants and non-homozygous loci of the variety tested. This is bound to affect the accuracy of uniformity assessments. We consider that wheat variety uniformity assessment depends on both the seed purity and homozygous loci ratio (HLR). The analysis of individual genotypes using SSR markers helps in detecting seed purity and SSR-HLR. If the seed purity and/or SSR-HLR are lower than the threshold values, the variety is not deemed to be uniform. When both the seed purity and SSR-HLR exceed the threshold values, the variety is deemed to be uniform (Wang et al., 2009a, 2009b; Liu et al., 2013; Wang et al., 2014a, 2014b).
Each wheat variety is a self-pollinating population derived from the offspring of crossing two parents. For each selfing event in an individual wheat plant, a heterozygous locus will segregate with a 1:2:1 ratio in the offspring, resulting in a non-homozygous locus in the offspring population. To differentiate it from a heterozygous locus of an individual plant, we define a non-homozygous locus as a locus with maternal and paternal homozygous genotypes as well as the parental heterozygote (aa, bb, and ab) among individuals of a line or a given variety. To differentiate homozygous locus of a plant, we define a homozygous locus of a line or variety as a locus with the same homozygous genotype among all individuals of a given variety. Non-homozygous loci are inherent in wheat varieties. The proportion of non-homozygous loci in the population of each later generation will be reduced because successive generations are derived from a selfing plant (individual) during breeding, but concurrently the HLR will increase. Wang et al. (2009b, 2014a) document the SSR-HLR of F4, F5 and F6 wheat lines as 84.7-94.8%, 96.1-99.4% and ≥98%, respectively, proving that most wheat varieties have non-homozygous loci; some morphological traits of F4 lines still segregate and inter-plant phenotypic differences are obvious; morphological trait segregation in most wheat lines ends at the F5 or F6 generations and thus these lines show morphological and agronomic uniformity even if they have non-homozygous loci. Breeders will choose the lines that perform best in terms of agronomic traits and raise the successive generations from those lines. At this point, the SSR-HLR in the population will become fixed. For example, if the SSR-HLR of an F5 plant is 95% of the genome, the SSR-HLR of the line derived from that plant will be 95%, and the SSR-HLR of the variety or cultivar derived from the line will be 95%. If the SSR-HLR of an F4 plant is 90% of the genome, the SSR-HLR of the line derived from that plant will be 90%, and the SSR-HLR of the variety or cultivar derived from the line will be 90% and inter-plant phenotypic differences are obvious.
However, inter-plant genotypic differences are caused not only by non-homozygous loci, but also by contaminant individuals (Wang et al., 2009b, 2014b). The contaminant individuals are from other varieties or hybrids with other varieties, and their genotypes at some loci are different from those of the variety being tested and are easily identified when DNA markers are used to genotype a number of loci. Therefore, it is essential to distinguish the genotypes of contaminant individual from non-homozygous SSR loci in evaluation of SSR-HLR (Wang et al., 2014a).
The key to evaluating seed purity is accurate identification of contaminant individuals. To accurately identify contaminant individuals, it is also essential to distinguish contaminant individual genotypes from non-homozygous SSR loci. In previously published studies on the assessment of crop seed purity with molecular markers, most authors attribute all inter-plant genotypic differences to contaminant individuals (see the references of Wang et al., 2014b). It is likely that the estimated seed purity is lower than the actual purity. To resolve the problem, we have proposed the method for discriminating two phenomena (Wang et al., 2014b). The methods for estimating seed purity and SSR-HLR of wheat varieties, based on discrimination of contaminant individual genotypes from non-homozygous SSR loci, are described elsewhere (Wang et al., 2014a, 2014b). This paper outlines the technical procedures and criteria for uniformity assessment based on both seed purity and SSR-HLR.
1 Results
Impact of non-homozygous SSR loci on the uniformity of wheat varieties
A variety is not uniform if contaminants and non-homozygous SSR loci exceed a certain proportion. Of 633 national winter wheat variety regional trials in China, about 10% of the varieties had ≥ 10% non-homozygous SSR loci. For example, 73 of 91 SSR loci of the variety A2009-75 were homozygous and the other 18 SSR loci were non-homozygous, resulting in a low SSR-HLR (80.2%). Of 18 non-homozygous loci, 11 loci had two homozygous genotypes (aa and bb) and the heterozygote (ab) among 20 individuals analyzed, and seven loci had only two homozygous genotypes due to small sample size. Number of individuals with different genotypes at eight of the 18 loci in 20 individuals is presented in Table 1. Given that the non-homozygous SSR loci result in different genotypes within a population of a particular variety, 20 individuals of A2009-75 were classified into 20 genotypes, which each differed from other genotypes at 1-19 loci. The genetic similarity coefficient (GS) of each pair of individuals with different genotypes ranged from 0.85-0.99. In most instances, a pair of varieties is phenotypically distinct if their GS is 0.85-0.99 (Wang et al., 2010; Wang et al., 2015). Therefore, most pairs of A2009-75 individuals with different genotypes exhibited genetic distinctness.
|
|
The grains of the 20 individual plants of A2009-75 were harvested in 2009, and grown by the plant-to- row method in the field the following years (2009–2010). Phenotypic and agronomic traits were compared among 20 rows following the Materials and Methods. Significant difference of plant height, flag leaf length, thousand-grain weight, and heading date among the rows were obvious (Table 2). This indicates that the variety was not attained uniformity and SSR-HLR could be an index of wheat variety uniformity.
|
|
Relationship between the homozygous SSR loci ratio and the uniformity of wheat varieties
To confirm the relationship between SSR-HLR and uniformity or stability of wheat varieties, a set of experiments were conducted in common because both detection of SSR-HLR and phenotypic observation provided the data for the two studies. In 2008, 2009 and 2010, the grains of 20 individual plants of 10-20 varieties with an SSR-HLR ≤ 95% in the regional trials were harvested annually, and grown by the plant-to-row method in the field the following years (2008-2009, 2009-2010 and 2010-2011). Concurrently, 5-10 varieties with an SSR-HLR > 95% were grown annually as a control. Phenotypic and agronomic traits were compared among 20 rows of each variety. A significant difference among the rows of a variety, according to the criteria described in Table 5, showed that the variety was still segregating and had not attained uniformity and stability. Among approximately 60 varieties, trait segregation was distinct in varieties with an SSR-HLR < 91%, but seldom occurred in varieties with an SSR-HLR > 95%. For a few of the varieties with an SSR-HLR ranging from 91% to 95%, the traits performed identically, but obvious segregation was also observed in other varieties. This indicated that the varieties with an SSR-HLR > 95% were uniform and stable, but the varieties with an SSR-HLR < 91% were not. The varieties with an SSR-HLR ranging from 91% to 95% required additional field observation for uniformity and stability assessment. The data listed in Table 3, which shared in an article about stability assessment (Wang et al., 2014a) and this article, shown the varieties not to be uniform and stable in the 3 years.
|
|
.png)
Criteria for uniformity assessment of wheat varieties using SSR markers
A variety is not uniform if it contains contaminant plants and/or non-homozygous loci above threshold values. The phenotype of a contaminant plant differs from those of the majority of plants in a wheat variety. In addition, a lower HLR also causes inter-plant phenotypic differences in a wheat variety. On the basis of the Chinese national standard (GB/T 19557.2-2004), the variety is uniform if off-type plants are less than 2.5% of at least 2000 individual plants. Our above- mentioned studies proved that a variety with an SSR-HLR > 95% is uniform. In other words, a variety is uniform if the SSR-HLR is > 95% and the seed purity is ≥ 97.5%. Considering the experimental cost of testing seed purity using SSR markers, the sample size is set at 100 individuals. Since the sample size is far less than the recommended 2000 individuals, the seed purity threshold is reduced to > 95% when assessing wheat variety uniformity. Therefore, the criteria for uniformity assessment of wheat varieties using SSR markers were established as follows.
(1) The variety shows uniformity if seed purity and SSR-HLR are both > 95%;
(2) A variety with an SSR-HLR < 91% is not uniform, even if the seed purity is > 95%;
(3) A variety with seed purity ≤ 95% is not uniform, even if the SSR-HLR is > 95%;
(4) A variety with an SSR-HLR ranging from 91% to 95% requires additional uniformity assessments in the field, even if the seed purity is >95%.
Technical procedures for wheat variety uniformity assessment using SSR markers
Our studies demonstrate that 30 and 80 SSR markers (Table 4) are reasonable for detection of seed purity and SSR-HLR, respectively (Wang et al., 2009b, 2014a, 2014b; Liu et al., 2013), and the appropriate sample sizes are 100 and 20 individuals, respectively. Of 80 SSR markers, each marker with an average PIC of 0.68 produced a single amplification product. The total number of alleles observed in 633 varieties was 666, with an average of 8.3 alleles on each locus. Considering the experimental cost and cycle of detection of SSR-HLRs, we proposed to divide the 80 SSR markers into 21 first-grades, 29 second-grade, and 30 third-grade markers (Table 4) based on their DNA banding clarity and polymorphism information content (PIC). Uniformity assessment of most of varieties relies on the 21 first-grade markers, and that of minority of varieties are completed by 50 markers (21 first-grade and 29 second-grade markers) or 80 markers.
|
|
.png)
|
|
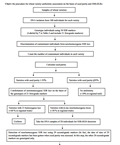
The 21 first-grade markers have sharper banding patterns and higher PIC (0.55-0.82). SSR-HLRs of the varieties with 21 homozygous loci are generally > 95% (Wang et al., 2014a). The 21 first-grade markers can be used to complete about 60% of uniformity assessment because the 21 loci of ~60% of the varieties tested are homozygous. The 29 second-grade markers are used in combination with the first-grade markers to complete assessment of a further 10% of varieties based on SSR-HLR of 50 loci. Only about 30% of varieties need to be tested with 80 SSR markers. The three-grade marker test system significantly reduces the time and cost involved in wheat variety uniformity assessment. The methods for the discrimination of contaminant individuals from non-homozygous SSR loci and for the detection of SSR-HLRs and the seed purity using SSR markers are described in the Materials and Methods. Here, the procedure for wheat variety uniformity assessment on the basis of seed purity and SSR-HLRs is outlined in the following flow chart.
2 Discussion
Innovations in this study
Non-homozygous loci are one cause of inter-plant genotypic and phenotypic differences among individuals of a variety. Nevertheless, it is not possible to result in phenotypic differences in a variety if the ratio of non-homozygous SSR loci is < 5% because a variety is classified as uniform if the SSR-HLR is > 95% on the basis of the 3-year study described aforementioned. Confusion of inter-plant genotypic differences caused by non-homozygous loci and contaminant plants can result in a false determination of non-uniformity for a variety, even if the seed purity and SSR-HLR of the variety are both > 95%.
The method for uniformity assessment of wheat varieties proposed here allows researchers to correctly distinguish inter-plant genotypic differences caused by contaminant plants from those caused by non-homo- zygous SSR loci. It enables more accurate and rapid uniformity assessment of wheat varieties. On average, assessment of one variety takes only seven days in our laboratory. The assessment report informs breeders of the seed purity and SSR-HLRs of their varieties. If the tested variety is not uniform, the report will help breeders identify the problem with the variety, and direct breeders to improve the seed purity or SSR-HLR, or both, of the variety. The concepts and methods proposed here will also be of benefit for the assessment of other crops and cultivated plants.
The same technical points on assessment of seed purity and DUS using SSR markers
To eliminate the interference of non-homozygous loci and accurately identify contaminant individuals when the seed purity of a wheat variety is assessed, it is necessary to discriminate the genotypes of contaminants from non-homozygous loci (Wang et al., 2014b). It is also necessary to discriminate the genotypes of contaminants from non-homozygous loci when distinctness of a wheat variety is assessed. To avoid errors in distinctness assessments of wheat varieties, we propose elimination of contaminant plants from the sample before comparison of varietal genotypes, and scoring the genotype at each locus with a pair of allele numbers for molecular profile. A homozygous locus is scored as two identical allele numbers and a non-homozygous locus is scored as two different allele numbers (Wang et al., 2015). On the basis of our studies on stability assessment, wheat varieties with an SSR-HLR > 95% are deemed stable; the varieties with an SSR-HLR < 91% are deemed unstable; and the varieties with an SSR-HLR ranging from 91% to 95% are required to undergo field observation for stability assessment (Wang et al., 2014a). Obviously, it is essential to eliminate contaminant plants from the sample and confirm non-homozygous loci among tested loci. As for uniformity assessment, detection of contaminants and the SSR-HLR are also essential. To sum up, the detection of contaminants and non-homozygous loci are the same technical requirements in assessments for seed purity and DUS of wheat variety. The methods for discrimination of contaminants from non-homozygous loci, detection of SSR-HLR, and detection of seed purity are identical in the different assessments. In assessments of DUS, 80 SSR markers (Table 4) are employed. Of these 80 SSR markers, 30 markers are sufficient for identification of contaminants or detection of seed purity.
Uniformity assessment of hybrid crops
This article focuses on uniformity assessment of self-pollinating wheat varieties. By applying the same concepts, the study of uniformity assessment of hybrid crops can be conducted. However, the causes of inter-plant differences are attributable to the presence of maternal self-pollinating plants, self-pollinating plants of other varieties, hybrid plants derived from crossing the maternal or paternal parent and another variety, and non-homozygous SSR loci to be inherent in the maternal and/or paternal parents. It is more difficult to identify contaminant plants and non-homo- zygous SSR loci in a hybrid variety. The method for identification of contaminants and non-homozygous SSR loci in hybrid wheat varieties is detailed elsewhere (Wang et al., 2014b), and can serve as a reference for other hybrid crops. Nonetheless, the criteria for uniformity assessment of hybrid crops on the basis of the detection of contaminants and non-homozygous SSR loci will require further study.
3 Conclusion
Adoption of the methods and technical procedures for wheat variety uniformity assessment proposed in this paper will enable more accurate and rapid assessments. The core aspect of the assessment of wheat variety uniformity is estimation of both seed purity and SSR-HLR. A variety shows uniformity if the seed purity and SSR-HLR are both > 95%. A variety with an SSR-HLR < 91% and/or seed purity ≤ 95% is non-uniform. The varieties with an SSR-HLR ranging from 91% to 95% require additional uniformity assessments in the field, even if the seed purity is > 95%, because not all of them will be uniform or not uniform. Those varieties make up less than 10% of the varieties tested, meaning that SSR markers are suitable for uniformity assessment of ~90% of wheat varieties. On average, assessment of one variety takes only seven days in our laboratory, and the assessment cycle is greatly shortened. Therefore, we recommend wider use of SSRs, and undertaking field testing for a few varieties as necessary, in the procedure for wheat variety uniformity assessment.
4 Materials and Methods
Plant material
A total of 633 varieties from the national winter wheat regional trials (2006-2007, 2007-2008, 2008-2009, 2009-2010, and 2010-2011) were tested in this study. The varieties were developed by institutions in Beijing, Hebei, Henan, Shanxi, Shandong, Shaanxi, Jiangsu, Sichuan, Anhui, Yunnan, and Gansu provinces. A letter “A” + the year of harvesting was designated as the initial for the code of the varieties.
DNA isolation and analysis of molecular markers
The sample of each variety involved 20 or 100 individuals. The genomic DNA of individual was extracted using a simplified cetyltrimethyl- ammonium bromide (CTAB) method (Ji et al., 2007). The protocol of polymerase chain reaction (PCR) and PCR products separation were the same as the previous article (Wang et al., 2014a).
SSR markers used in this study
Eighty SSR markers (Table 4), including 67 genomic-SSRs and 13 EST-SSRs (SSRs derived from expressed sequence tag) used to assess uniformity, were selected from 1100 SSR markers on basis of their distribution on 21 chromosomes, relatively high PIC, clear DNA banding patterns making different genotypes easy to distinguish, and stable PCR amplification. The SSR and EST-SSR primer sequences presented in Table 4 were obtained from http://wheat.pw.usda.gov/GG2 and cited from papers (Röder et al., 1998; Pestsova et al., 2000; Sourdille et al., 2001; Guyomarc’h et al., 2002; Gupta et al., 2002; Gao 2003; Yu et al., 2004; Chen et al., 2005; Song et al., 2005).
Recording the genotypes at an SSR locus of individuals in a variety
When recording the genotype at an SSR locus among individuals in a variety, the most common homozygous genotype was designated aa, the second-most common was designated bb, and so on. The genotypes were generally designated from aa to ff in order of most to least common. Heterozygotes were designated ab, ac, bc, and so on. The genotype at each SSR locus of each individual in this study was recorded in a table, as represented by Table 5.
|
|
.png)
Determination of non-homozygous SSR loci
The causes of non-homozygous SSR loci in wheat varieties have been addressed in the Introduction. Three genotypes at a non-homozygous locus among individuals of a variety are possible, namely the maternal and paternal homozygous genotypes, and the parental heterozygous genotype (aa, bb, and ab). The ratio of individuals with maternal and paternal homozygous genotypes should theoretically be 1:1 (Wang et al., 2014a). However, because of genetic segregation distortion of heterozygotes or for other reasons, it is often the case that the number of individuals with maternal or paternal homozygous genotypes at a non-homozygous locus is overwhelmingly large in a population, and the ratio of individuals with two parental homozygous genotypes is almost 10:1 or higher. We termed these as non-homozygous SSR loci due to distortion of allele distribution, and treated them as homozygous ones because that locus had little influence on the uniformity of the variety (Wang et al., 2009b, 2014a).
20 or 100 individual plants sampled from each variety tested were genotyped by the SSR markers mentioned. The 1:1 goodness-of-fit test was employed to determine whether a non-homozygous SSR locus had an allele frequency be apt to only one parent. When χ2 ≤ 6.63 (χ20.01, 1 = 6.63), the ratio of individuals with maternal and paternal genotypes at a non-homozygous SSR locus in 20 individuals was considered to meet 1:1, so that the locus was a theoretical non-homoz-
ygous one. Otherwise, when χ20.01, 1 > 6.63, the locus was considered the non-homozygous locus due to distortion of allele distribution.
Detection of the homozygous SSR loci ratio
Twenty individuals of each variety were detected by 50 or 80 SSR markers. A homozygous locus was one with the same genotype in 20 individuals. A locus with two homozygous genotypes among individuals of a variety (if there were no contaminant individuals) was regarded as a non-homozygous locus whether or not heterozygotes were observed. The SSR-HLR is defined as the number of the homozygous loci as a percentage of the total number of loci tested.
The following formula was used to calculate the SSR-HLR (Wang et al 2014a):
![]()
Where n is the number of loci detected, and x is the number of non-homozygous SSR loci.Identification of contaminant individualsThirty SSR markers (labeled by * in Table 4) including 26 genomic-SSRs and four EST-SSRs used to detect seed purity. Each individual plants sampled from the tested varieties were genotyped by the 30 SSR markers. The genotypes of each SSR locus among most plants of each variety were identical; these plants served as the control (Ck) for identifying contaminants. The locus with different genotype from that of Ck was deemed to be an off-type locus. The individual was deemed to be a contaminant for assessment of seed purity if there were > 2 off-type and/or heterozygous loci at the 30 SSR loci of the individual (Wang et al., 2014b).
Calculation of seed purity
Seed purity is defined as the number of true individuals as a percentage of the total number of seeds tested (100 seeds), and was calculated as follows:
![]()
Where 100 is the number of individuals tested and n is the number of contaminant individuals.
Discriminance of contaminant individual genotypes from non-homozygous SSR loci
As the discussion aforementioned, it is necessary to discriminate contaminant individual genotypes from non-homozygous SSR loci in assessments of seed purity and DUS of wheat variety using SSR marker. For clarity, the discriminance have to be reproduced here. To illustrate the distinction of the two phenomena, the 20 SSR loci genotypes of 30 individuals from the wheat variety WJ02 are presented in Table 5, which was given as an example in an article about the assessment of wheat seed purity (Wang et al., 2014b).
At the 20 SSR loci, the genotypes of only six loci (Xgdm72, Xcfd76, Xksum62, Xgwm304, Xbarc198, and Xcfa2028) were uniform among individuals of WJ02. The genotypes at 14 loci differed among individuals. These results showed the presence of contaminants and non-homozygous SSR loci in WJ02. The genotypes at > 3 out of 20 loci of WJ02 individuals 2, 3, 5, 8, 10, and 27 differed from those of other individuals. These six individuals were considered to be contaminants according to the criteria aforementioned.
After omitting the data for these six contaminant individuals, whether SSR loci are non-homozygous is readily estimated from the remaining data. The genotypes at 18 loci of 24 individuals were aa, with the exception of Xgwm294 and Xcfd72. Three genotypes (aa, bb, and ab) were detected at gwm294. The numbers of individuals with the three genotypes were 19, 3, and 2, respectively. This locus was deemed to be a non-homozygous SSR locus due to distortion of allele distribution because χ2 = 9.38 on the basis of the 1:1 goodness-of-fit test aforementioned, and thus gwm294 was treated as a homozygous locus. Two genotypes (aa and bb) were detected at Xcfd72. The number of individuals with the two genotypes were 17 and 7 (χ2 = 3.38). This locus was deemed to be a theoretical non-homozygous locus.
Observation of morphological traits
To determine the relationship between the SSR-HLR and the uniformity of the wheat varieties, the grains of individual plants of nearly 60 varieties with an SSR-HLR ≤ 95% from the national winter wheat regional trials in 2008, 2009 and 2010 were harvested, and were then grown by the plant-to-row method in the following years (2008-2009, 2009-2010 and 2010-2011). The phenotypic and agronomic traits were compared among different rows of a variety. If the rows of a variety were distinct from each other, according to the criteria in Table 6, it indicated that the variety was still segregating and was not uniform. Concurrently, 10-20 varieties with an SSR-HLR > 95% were grown in blocks. Phenotypic and agronomic traits were then compared among different individuals of a variety. 30 to 50 individuals were sampled from each row or block to investigate the phenotypic and agronomic traits listed in Table 6.
|
|
.png)
Calculation of genetic similarity coefficient
In this paper, the GS was used to evaluate the similarity between two plants. The GS between two plants is close to 1.0 if they share the same genotype. When two plants were scored as having the same genotype at a locus, the locus was increased by 1 as the numerator of the formula for calculating GS. For a heterozygous locus in a plant, 0.5 was added as the numerator if its genotype for one allele was the same as the homozygous genotype at the same locus of another plant. For example, the SSR locus Xgwm294 of plant 18 and 19 of variety WJ02 is homozygous and heterozygous, respectively (Table 5), therefore 0.5 was added as the numerator of the formula for calculating GS because the genotype of one allele of plant 19 is the same as that of plant 18. Moreover, if a locus for two plants was heterozygous, and the genotypes for one allele were the same but those for another allele differed between the two plants, 0.5 was added also as the numerator because one allelic genotype differed between the two plants. The numerator was divided by the total number of loci compared between two plants.
The formula for calculating GS was:
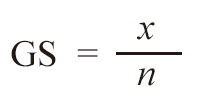
Where x is the number of loci with the same genotype between two plants, n is the number of loci compared between the two plants, and 1 is a correction value owing to the limited number of markers tested.
Acknowledgments
This study was funded by the Innovation Platform for Basic Research in Breeding of Beijing (D08070500690801), China and the Financial Program of the Ministry of Agriculture (2011 and 2012), China.
References
Chen H.M., Li L.Z., Wei X.Y., Li S.S., Lei T.D., Hu H.Z., Wang H.G., and Zhang X.S., 2005, Exploitation chromosomal location and genetic mapping of EST-SSRs in wheat, Chinese science bulletin, 50: 2208-2216 (in Chinese)
http://dx.doi.org/10.1007/BF03183744
Cooke R.J., Bredemeijer G.M.M., Ganal M.W., Peeters R., Isaac P., Rendell S., Jackson J., Röder M.S., Korzun V., Wendehake K., Areshchenkova T., Dijcks M., Laborie D., Bertrand L., and Vosman B., 2003, Assessment of the uniformity of wheat and tomato varieties at DNA microsatellite loci, Euphytica, 132: 331-341
http://dx.doi.org/10.1023/A:1025046919570
De Riek J., Calsyn E., Everaert I., Van Bockstaele E., and De Loose M., 2001, AFLP based alternatives for the assessment of distinctness, uniformity and stability of sugar beet varieties, Theoretical and applied genetics, 103: 1254-1265
http://dx.doi.org/10.1007/s001220100710
Gao L.F., 2003, Molecular markers of SSRs and SNPs derived from ESTs and their application, Chinese Academy of Agricultural Sciences post-doctoral work report (in Chinese)
Gupta P., Balyan H., Edwards K., Isaac P., Korzun V., Röder M., Gautier M.F., Joudrier P., Schlatter A., Dubcovsky J., De la Pena R., Khairallah M., Penner G., Hayden M., Sharp P., Keller B., Wang R., Hardouin J., Jack P., and Leroy P., 2002, Genetic mapping of 66 new microsatellite (SSR) loci in bread wheat, Theoretical and applied genetics, 105: 413-422
http://dx.doi.org/10.1007/s00122-002-0865-9
Guyomarc’h H., Sourdille P., Charmet G., Edwards K.J., and Bernard M., 2002, Characterisation of polymorphic markers from T. tauschii and transferability to the D-genome of bread wheat, Theoretical and applied genetics, 104: 1164-1172
http://dx.doi.org/10.1007/s00122-001-0827-7
Ji W., Wang L.X., Sun H., Wang M.Y., and Zhao C.P., 2007, Predigestion of wheat SSR analysis protocol, Journal of Agricultural Biotechnology, 15: 907-908 (in Chinese)
Liu L.H., Pang B.S., Wang L.X., Li H.B., Zhang X., Cai J.L., and Zhao C.P., 2013, Comparing the Accuracy of SSR Markers and Gliadin Analysis for Testing Seed Purity in Wheat, Journal of Triticeae Crops, 33: 429-434 (in Chinese)
Lu G.Y., Wu X.M., Zhang D.X., Liu F.L., Chen B.Y., Gao G.Z., and Xu K., 2008, SSR-based evaluation of distinctness and uniformity of rapeseed (Brassica napus L.) varieties under Chinese national official field tests, Scientia Agricultura Sinic, 41: 32-42 (in Chinese)
Pestsova E., Ganal M.W., and Röder M.S., 2000, Isolation and mapping of microsatellite markers specific for the D genome of bread wheat, Genome, 43: 689-697
http://dx.doi.org/10.1139/g00-042
Röder M S, Korzun V, Wandehake K, Planschke J, Tixier M H, Leroy P, and Ganal M W. 1998, A microsatellite map of wheat. Genetics, 149, 2007-2023
Song Q.J., Shi J.R., Singh S., Fickus E.W., Costa J.M., Lewis J., Gill B.S., Ward R., and Cregan P.B., 2005, Development and mapping of microsatellite (SSR) markers in wheat, Theoretical and applied genetics, 110: 550-560
http://dx.doi.org/10.1007/s00122-004-1871-x
Sourdille P., Guyomarc’h H., Baron C., Gandon B., Chiquet V., Artiguenave F., Edwards K., Foisset N., Dufour P., and Bernard M., 2001, Improvement of the genetic maps of wheat using new microsatellite markers, Proceedings of the 9th plant and animal genome, Final Abstract Guide, San Diego, pp.425 and pp.167
Wang F.G., Zhao J.R., Dai J.R., Wang L., Yi H.M., Guo J.L., Sun S.X., Liao Q., and Yang G.H., 2007, Uniformity analysis of maize varieties by a set of SSR markers, Molecular Plant Breeding, 5: 95-104 (in Chinese)
http://dx.doi.org/10.1016/S1875-2780(08)60117-0
Wang L.X., Chang L.F., Li H.B., Ge L.L., Xin A.H., Gao S.Q., Ji W., Sun H., and Zhao C.P., 2009a, Method of testing wheat seeds purity by molecular markers, Journal of Triticeae Crops, 29: 1-8 (in Chinese)
Wang L.X., Ji W., Li H.B., Ge L.L., Xin A.H., Wang L.X., Chang L.F., and Zhao C.P., 2009b, Evaluating uniformity and stability of wheat cultivars based on ratio of homozygous DNA locus, Acta Agronomica Sinica, 35: 2197-2204 (in Chinese)
Wang L.X., Li H.B., Liu L.H., Pang B.S., and Zhao C.P., 2014a, Assessment of wheat variety stability based on SSR markers, Euphytica, 195: 435-452
http://dx.doi.org/10.1007/s10681-013-1006-z
Wang L.X., Liu L.H., Li H.B., Pang B.S., Zhang F.T., and Zhao C.P., 2014b, Detecting Seed Purity of Wheat Varieties Using Microsatellite Markers based on eliminating the influence of non-homozygous loci, Seed Science and Technology, 42: 393-413
http://dx.doi.org/10.15258/sst.2014.42.3.07
Wang L.X., Qiu J., Chang L.F., Liu L.H., Li H.B., Pang B.S., and Zhao C.P., 2015, Assessment of wheat variety distinctness using SSR markers, Journal of Integrative Agriculture (to be accepted)
Yu J.K., La Rota M., Kantety R.V., and Sorrells M.E., 2004, EST derived SSR markers for comparative mapping in wheat and rice, Molecular Genetics Genomics, 271: 742-751
http://dx.doi.org/10.1007/s00438-004-1027-3


. PDF(538KB)
. FPDF
. HTML
. Online fPDF
Associated material
. Readers' comments
Other articles by authors
. Wang L.X.
. Pang B.SH.
. Liu L.H.
. Li H.B.
. Zhao C.P.
Related articles
. Wheat variety
. Uniformity
. SSR markers
. Homozygous loci ratio of SSR markers
Tools
. Email to a friend
. Post a comment