Development and Validation of Markers Closely Linked to Crown Rot Resistance in Wheat and Barley 
2. Tasmanian Institutes of Agricultural Research and School of Agricultural Science, University of Tasmania, P.O. Box 46, Kings Meadows, Tasmania 7250, Australia
 Author
  Correspondence author
Molecular Plant Breeding, 2012, Vol. 3, No. 8 doi: 10.5376/mpb.2012.03.0008
Received: 04 May, 2012 Accepted: 16 May, 2012 Published: 20 Jun., 2012
Li et al., 2012, Development and Validation of Markers Closely Linked to Crown Rot Resistance in Wheat and Barley, Molecular Plant Breeding, Vol.3, No.8 80-90 (doi: 10.5376/mpb.2012.03.0008)
Crown rot (CR), caused by various Fusarium species, is a chronic cereal disease in Australia and many other parts of the world. As part of our objective of improving the efficiency of breeding CR resistant wheat and barley varieties, we have been searching for novel sources of resistance and identifying new genes conferring CR resistance in the two crops. This paper reports on the development of more closely linked markers and validation of the effects of the previously identified wheat 3B CR QTL and the barley 3H major CR locus using four wheat and three barley validation populations. With an effect varied from 36.7 to 59.4% in wheat and 29.4 to 55.2% in barley, the validation experiments demonstrated that both of the 3B and 3H CR locus have a stable and significant effect in reducing CR severity at different genetic backgrounds. The huge effect of a single QTL as the CR loci detected in this study warrant a significant value of incorporating these two genes in wheat and barley breeding. The possible homoeologous relationship between these two major CR loci is preliminarily investigated by comparative mapping the two genomic regions and it warrants further investigation.
Crown rot (CR) is a severe and chronic disease of cereals found in many parts of the world (Chakraborty et al., 2006). Both barley and wheat can be seriously affected by CR, which has recently become more prevalent due to the widespread adoption of minimum tillage (reviewed by Chakraborty et al., 2006) as CR pathogens are carried over in residues (Wildermuth et al., 1997; Wallwork et al., 2004). A recent study by Daniel and Simpfendorfer (2008) found that, on average, CR caused 25% yield loss in bread wheat, 58% in durum, and 20% in barley across a wide range of environments in Australia. A survey in the Pacific Northwest of the USA found that CR could reduce yield of winter wheat by 35% and barley by 13% in commercial fields (Smiley et al., 2005). In addition to yield loss, CR infected plants in glasshouse assays have been shown to contain mycotoxins (Mudge et al., 2006), which may potentially have adverse health effects if high levels are present in food and feed products.
Growing resistant varieties has long been recognised as the most effective way to minimize CR damage, and there have been efforts in breeding CR resistance in Australia. However, varieties with high levels of resistance are not yet available. Studies on CR have mainly considered disease incidence and severity with very few reports on yield loss. It was reported that effects of CR are slightly different for wheat and barley (Smiley et al., 2005; Daniel and Simpfendorfer, 2008). These studies support the notion that, although barley gets more severe CR symptoms than bread wheat (Wildermuth and Purss, 1971; Burgess et al., 1987; Klein et al., 1989), they are more tolerant to CR infection and suffer less yield loss than wheat.
A few of the wheat genotypes with moderate CR resistance have been identified and used for molecular mapping studies. The first study reported the CR resistance in the variety ‘Kukri’. The resistance of adult plants of this variety was assessed by growing plants in open-ended tubes placed in outdoor terraces. Bulked segregant analysis identified a locus on chromosome 4B near the semi-dwarfing gene Rht1 (Wallwork et al., 2004). The second genotype investigated was the breeding line ‘2-49’. Based on a seedling assay, two different quantitative trait loci (QTL) conferring CR resistance were detected from this genotype. One of them, located on chromosome arm 1DL, explained up to 21% of phenotypic variance. The other, located on chromosome arm 1AL, explained up to 10% of the variance (Collard et al., 2005). The third report was on the genotype ‘W21MMT20’, again based on a seedling assay (Bovill et al., 2006). These authors reported several putative QTL conferring CR resistances. However, none of them reached significant levels in all of the three assays reported. The most significant QTL was located on 5D. It reached significant levels in two of the three trials and explained up to 28.0% of the phenotypic variance. The other QTL, located on 2D, reached significant level in only one of the three assays conducted and it explained 10.2% of the phenotypic variance. These variable results are not surprising as accurate CR assessment is notoriously difficult (Collard et al., 2005). It is of note that none of the five loci derived from the three different resistant genotypes co-locate. They were found on five different chromosomes. However, recent studies have identified a major QTL on the long arm of chromosome 3B for CR resistance in three different wheat genotypes (Li et al., 2010a; Ma et al., 2010, Bovill et al., 2010). The magnitude of the 3B CR QTL identified in these genotypes explained up to 34.6%, 40.2%, and 46.2% of the phenotypic variance with detection in each of the trials in the three independent studies. Although the three genotypes are totally different, one is a modern wheat variety from USA, another is an Australian breeding line, and the third is an old landrace from India; a major QTL was identified in each of these resources and they were mapped to a very similar position on 3BL (Li et al., 2010a; Ma et al., 2010; Bovill et al., 2010).
Compared to bread wheat, genetic studies on CR resistance in barley is lag behind. However, a major QTL for CR resistance in barley has recently been identified from the Chinese landrace ‘TX9425’ which showed a moderate resistance to CR, markers linked to this QTL on the long arm of chromosome 3H count for over 60% of the phenotypic variation in resistance (Li et al., 2009). The discovery of promising QTLs for a trait of interest is an important, but primary step in developing a marker-assisted selection program for genetic improvement. Ideally, the identified QTLs should be validated in additional genetic backgrounds and environments and should not have undesirable effects on other important traits. Moreover, because the chromosome 3H in barley has a possible co-linearity with the group 3 chromosomes in wheat (Devos and Gale, 1993). It is interesting to know whether the 3B CR QTL in wheat and the 3H CR QTL in barley is homoeoalleles having a common origin. If a homoeoallellic relationships between the two loci exist, it would be much easier to characterise and isolate this gene in barley because barley is a diploid, self-pollinating species for which an experimental population can be developed with relative ease, and because barley has relatively few chromosomes, which can avoid any confounding effects from other homologous groups as it is in wheat.
The present study was carried out (1) to develop locus-specific molecular markers closely linked to the wheat 3B and barley 3H CR locus; (2) to validate the effect of the two loci in different genetic backgrounds in wheat and barley respectively for the purpose of using these major genes in breeding commercial wheat and barley varieties in the future; and to understand the possible homoeoallellic relationship between the wheat 3B and barley 3H CR loci.
1 Results
1.1 Development of more closely linked locus-specific markers in the regions conferring CR resistance on chromosomes 3B and 3H
The wheat 3B CR QTL was previously identified between two DArT markers, which were 9.4 cM apart (Li et al., 2010a). In order to more precisely determine the position of the QTL, and identify more closely linked locus-specific markers that can be used for validation this QTL in different genetic backgrounds and in breeding for CR resistance in wheat. A total of 28 publicly available wheat PCR-based primers from this region or nearby (Somer et al., 2006; Paux et al., 2008) were screened for their polymorphisms in the population of Ernie/Batavia. Among these wheat primers, only 32% showed polymorphism between the two parents Ernie and Batavia and about 11% have more than one polymorphic PCR products (S-Table 1). A high-resolution linkage map for the 3B CR QTL region was established by insertion of the nine polymorphic simple sequence repeat (SSR) markers into this region (Figure 1). The QTL was precisely located to a 7-cM region flanked by co-dominant SSR markers gwm0181 and wmc0471 (Figure 2).
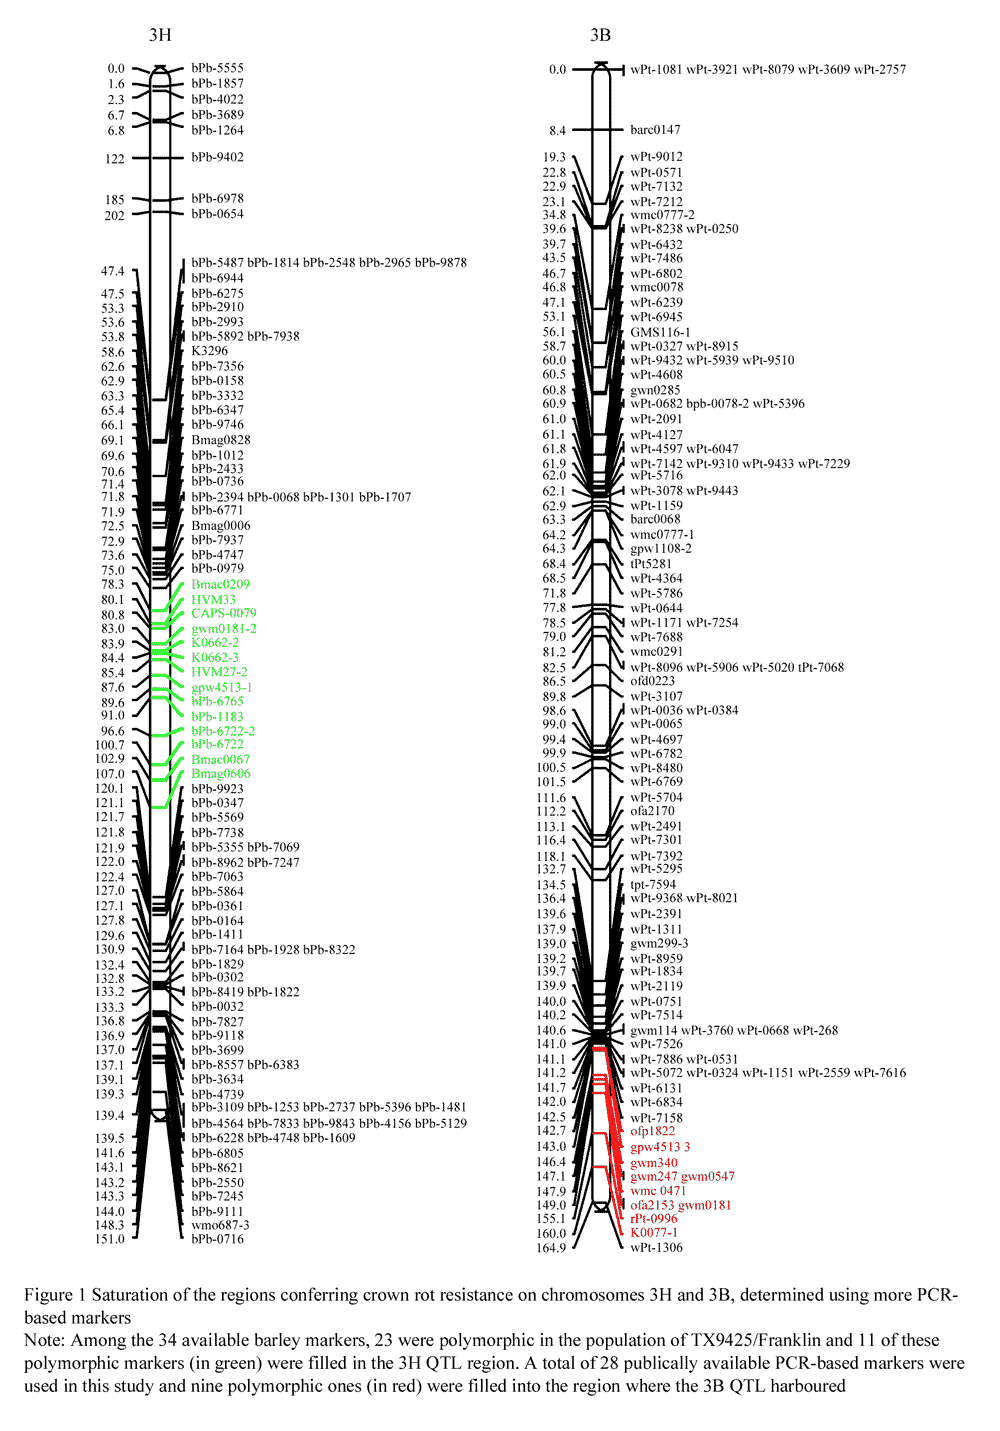 Figure 1 Saturation of the regions conferring crown rot resistance on chromosomes 3H and 3B, determined using more PCR-based markers |
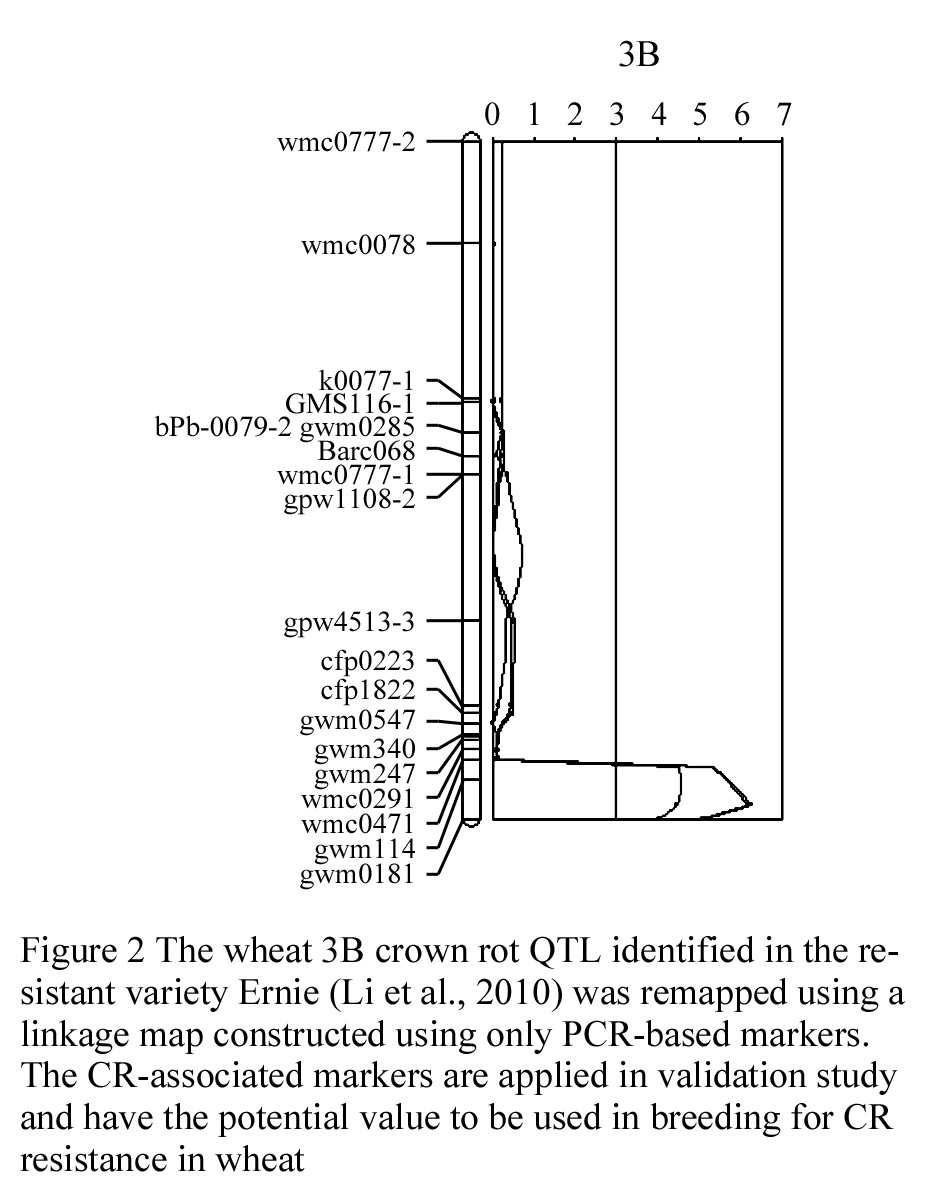 Figure 2 The wheat 3B crown rot QTL identified in the resistant variety Ernie (Li et al., 2010) was remapped using a linkage map constructed using only PCR-based markers. The CR-associated markers are applied in validation study and have the potential value to be used in breeding for CR resistance in wheat |
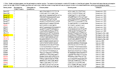 S-Table 1 Barley and wheat primers used for polymorphism markers analysis. The number of polymorphic scorable PCR products is listed for each primer. The primers with more than one polymorphic product in the barley TX9425/Franklin population are in red colour, while the primers having more than one polymorphic product in the wheat Ernie/Batavia population are highlighted yellow |
The barley 3H CR QTL was originally located to an interval between the DArT markers bPb-4747 and bPb-6765, which are 12.1 cmM apart (Li et al., 2009). Four PCR-based primers were designed from the DNA sequences representing the four DArT markers, which are associated with the barley 3H CR QTL (Li et al., 2009). Three of the four newly developed PCR-based markers showed polymorphism and only one (CAPS-0079) was mapped to the same position as the original DArT markers (bpb-0079). A total of 30 publicly available PCR-based primers from barley 3H (Ramsay et al., 2000) were also screened for their polymorphism between the two parents TX9425 and Franklin for the purpose of identification of locus-specific markers, which can be used in barley CR breeding. About 68% of these primers showed polymorphism and about 24% have more than one polymorphic PCR products (S-Table 1). However, only 11 of the polymorphic markers were inserted into the barley 3H CR region make the resolution of this region reached to an average of 1.1 cM between the two markers (Figure 1). The two closely linked co-dominant SSR markers Bmac0209 and HVM 33, with 1.8 cM apart, were identified flanking this QTL (Figure 3).
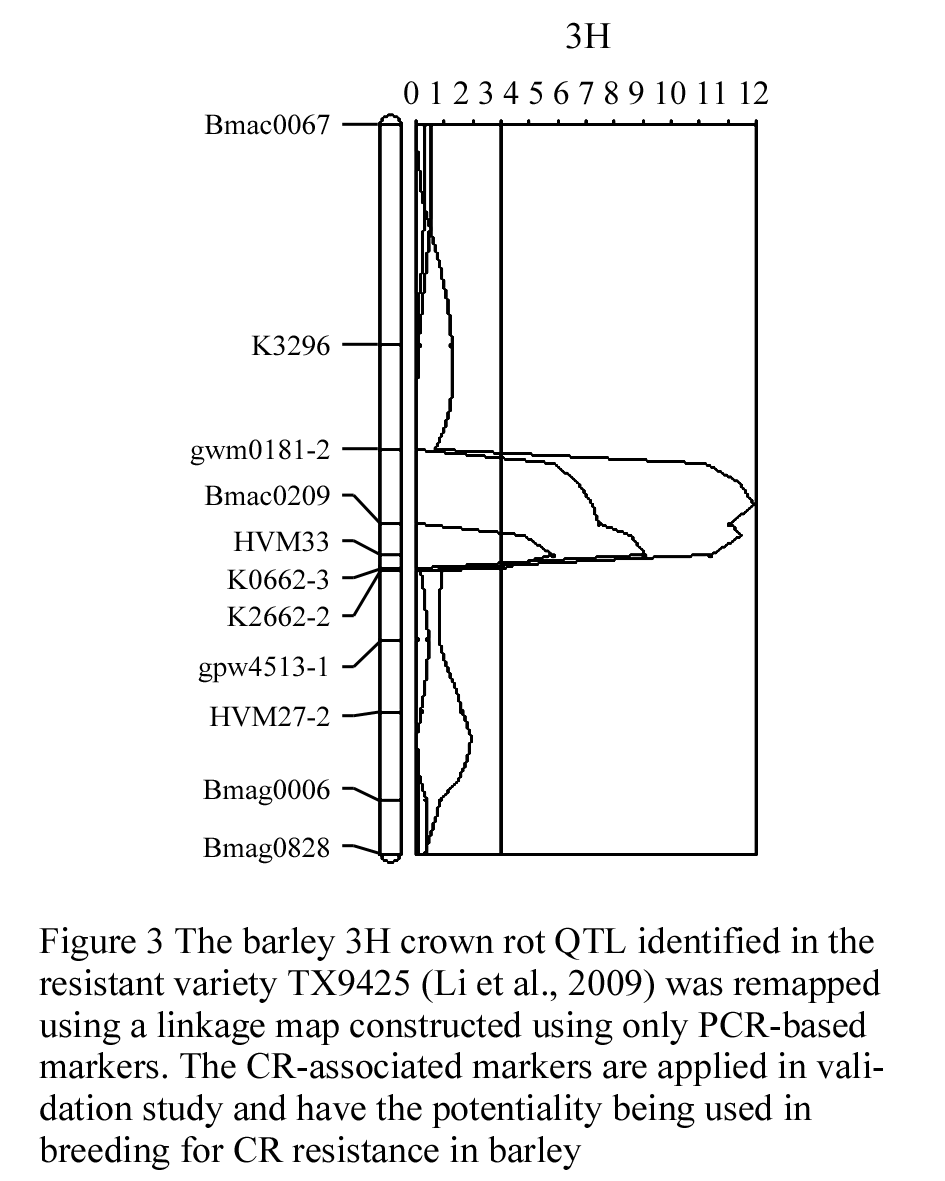 Figure 3 The barley 3H crown rot QTL identified in the resistant variety TX9425 (Li et al., 2009) was remapped using a linkage map constructed using only PCR-based markers. The CR-associated markers are applied in validation study and have the potentiality being used in breeding for CR resistance in barley |
In order to test the transferability of PCR based markers between wheat and barley and comparative mapping the barley 3H CR QTL and the wheat 3B CR QTL, the same list of barley primers was applied to screen polymorphism between the wheat parents Ernie and Batavia, while the wheat primers were applied to screen between the barley parents TX9425 and Franklin. The polymorphism study showed that around 54% of the wheat primer showed polymorphism in barley and 56% of the barley primer showed polymorphism in wheat. However, the specificity of these primers was reduced when they were applied to the opposite crop, for example, 32% of the wheat primers have more than one polymorphic PCR products in barley and 15% of the barley primers have more than one polymorphic PCR products in wheat (S-Table 1). Comparative mapping of the 3H and 3B CR regions showed that none of 11 barley markers linked to 3H CR resistance can be mapped to wheat chromosome 3B, and only two of the nine wheat SSR markers linked to 3B CR resistance locus were mapped to an interval on barley chromosome 3H. However, it is interesting finding that the two wheat CR-associated SSR markers were mapped to a region overlapping the barley 3H CR QTL region (Figure 4).
.png) Figure 4 Comparative mapping of the chromosomal regions conferring crown rot resistance on barley 3H and wheat 3B, determined using only SSR markers |
1.2 Validation of 3B QTL
The phenotypic data for the four wheat validation populations all showed a continuous distribution (Table 1). The microsatellite markers closely linked with the wheat 3B major CR resistance locus, gwm0181 and wmc0471, were used to identify homozygous individuals with (RR) or without (rr) the resistant locus on 3BL from the resistant parent Ernie. The segregation ratios of the two markers fit the expected ratio of 1:1 in the related validation populations. The average scores of CR severity differed among the four populations, with the F3 population of 10903/Ernie giving the lowest scores for both of the RR (0.87) and rr (2.31) classes (Table 2), and the F5 population of Kenedy/Ernie giving the highest scores (1.38 for RR and 3.56 for rr, respectively). The effects of the 3B locus, based on the differences in the average severities between the homozygous RR and rr individuals, varied from 36.7 to 61.2% with an average of 47.6% among the four validation populations (Table 2).
Table 1 Distribution of crown rot severity in the four wheat validation populations |
Table 2 Effects of the 3B crown rot QTL in four wheat validation populations |
1.3 Validation of 3H QTL
The phenotypic data for the three barley validation populations all showed a continuous distribution (Table 3). The microsatellite markers closely linked with the major barley 3H CR resistance locus, Bmac0209 and HVM33, were used to identify homozygous individuals with (RR) or without (rr) the resistant locus from the resistant parent TX9425. The segregation ratios of the two markers fit the expected ratio of 1:1 in all the three validation populations. The average scores of CR severity differed among the three populations, with the F3 population of TX9425/DYSYH giving the lowest scores for both of the RR (1.20) and rr (2.71) classes (Table 4), and the F5 population of TX9425/Naso Nijo giving the highest scores (1.74 for RR and 3.21 for rr, respectively). The effects of the 3H locus, based on the differences in the average severities between the homozygous RR and rr individuals, varied from 41.7 to 55.4%, with an average of 46.7% among the three validation populations (Table 4).
Table 3 Distribution of crown rot severity in the three barley validation populations |
Table 4 Effects of the 3H crown rot QTL in three barley validation populations |
2 Discussion
2.1 The potentiality of using the CR loci in wheat and barley breeding practice
Both wheat and barley can be seriously affected by CR disease (Wildermuth and Purss, 1971). Extensive genetic studies on CR have been carried out in bread wheat and several loci conferring CR resistance have been reported for bread wheat, and were located on chromosomes 4B (Wallwork et al., 2004), 1A and 1D (Collard et al., 2005), and 2B, 2D, and 5D (Bovill et al., 2006). However, the effect of these reported QTL was not stable and none of them reached significant levels in all of the trials conducted in the related study. This makes it very hard for breeders to incorporate CR resistance from these reported sources into commercial varieties and to track down the resistance genes in the progenies derived from these sources.
Fortunately, recent studies have identified a major QTL on the long arm of chromosome 3B conferring CR resistance in three different wheat genotypes, two of them belong to T. aestivum (Li et al., 2010a; Bovill et al., 2010), another belong to T. spelta (Ma et al., 2010). The magnitude of the 3B CR QTL identified in the wheat genotypes ‘Ernie’ and ‘CSCR6’ explained up to 34.6% and 46.2% of the phenotypic variance with detection in each of the trials with the use of two different F. pseudograminearum and F. graminearum isolates. Although these two genotypes are totally different, one is a modern wheat variety from USA, the other is an old landrace from India, only one QTL was identified in each of these two resources and they were mapped to a very similar position on 3BL (Li et al., 2010a; Ma et al., 2010). The major QTL identified in the third resource ‘W21MMT20’ (an Australian breeding line) was also located to a position close to the distal end of chromosome 3B, although the author of this study failed to detect the QTL in their previous study using this same resistant resource (Bovill et al., 2006). However, the 3B major CR locus identified in the three recent studies indicates that this gene could be a dawn for wheat breeders in their effort of attacking crown rot disease and breeding resistant wheat varieties. Compared to wheat, genetic studies on CR resistance in barley are lacking. However, a major QTL for CR resistance in barley has recently been identified from the cultivar ‘TX9425’, and markers linked to this QTL on the long arm of chromosome 3H account for over 60% of the phenotypic variation in resistance (Li et al., 2009).
Because a significant proportion of the markers used in our previous QTL study (Li et al., 2009; 2010a) were DArT markers, it is important to develop closely linked PCR-based markers, which can be used to validate the effect of the 3B and 3H CR locus and for use in breeding programs. Four different wheat populations and three barley populations were used in this study to validate the effects of the 3B and 3H CR locus. With an effect varied from 36.7 to 59.4% in wheat and 29.4 to 55.2% in barley, the validation experiments in this study demonstrated that both the 3B and 3H CR locus have a stable and significant effect in reducing CR severity at different genetic backgrounds. The huge effect of a single gene as the CR locus detected in this study warrant a significant value of incorporating these two genes in wheat and barley breeding.
2.2 The possible homoeologous relationships between the 3B and 3H CR QTL
Wheat and barley are two important grass species that may have a common gene pool and share a significant level of synteny (Ahn et al., 1993; Morre et al., 1995). Findings from these comparative mapping studies between grass families is of considerable values to plant breeders, since it means that similar genes in different plants can be treated as essentially allelic variants, and the different alleles can be transferred, more or less at will, from one species to another to improve or alter the performance of a crop.
The major CR QTL identified in the wheat variety Ernie and the barley genotype TX9425 have large effects on enhancing CR resistance, and they are both located on the long arms of the homoeologous group 3 chromosomes, with the barley CR locus proximal to the centromere of chromosome 3H (Li et al., 2009) and the one in wheat close to the distal end of wheat chromosome 3BL (Li et al., 2010). The possible homoeologous relationship between these two major CR loci may exist because chromosome 3H in barley has been reported to show a virtual collinearity with wheat chromosome 3B (Devos and Gale, 1993). However, recent studies investigating microcolinearity in the grass family has revealed numerous small rearrangements of gene content, order, and orientation between different grass genomes (Bennetzen and Ramakrishna, 2002); therefore, the arms of barley chromosomes may not be a completely identical to the genetically equivalent of the arms of wheat chromosome.
The low transferability of PCR markers between wheat and barley as showed in this study make the comparative mapping between the two crops very labour extensive and less efficient. However, the comparative mapping attempt in this study indicated that the barley 3H CR locus may be a homologous allele of the 3B CR resistance locus because the flanking markers of the wheat 3B CR locus were mapped to a barley genomic region, which co-locate with the barley 3H CR locus. Moreover, three markers from a region harbouring a CR major QTL on barley chromosome 3H were mapped to a region of chromosome 3B in wheat, which is only 15 cM away from the CR major locus identified on this chromosome. A small distance between the wheat CR locus and the region harbouring barley SSR marker on chromosome 3B results in a reasonable inference that the two regions could overlap if more markers were used in comparative mapping of the regions associated with CR resistance in wheat and barley. If the homoeologous allelic relationship is true between the barley 3H CR QTL and the wheat 3B CR Locus, it could be relatively easier to characterise the functional expression of the candidate genes underlie the homologous locus and to isolate this major gene for CR resistance in barley than in wheat, considering the difference in chromosome sets and genome size between the two crops.
3 Materials and Methods
3.1 Wheat and barley populations used in this study
A wheat doubled haploid (DH) population consisting of 153 lines derived from a cross between two bread wheat varieties Batavia and Ernie was used for mapping QTL conferring CR resistance and for comparative mapping; a linkage map was constructed for this population by using 104 SSR and 852 DArT markers (Li et al., 2010a). Ernie is an American soft red winter wheat variety with high-level resistance to CR, and Batavia is an Australian variety highly susceptible to this disease. Four additional populations were developed for validating the effect of the 3B major QTL derived from the resistant variety Ernie (Li et al., 2010a). The four validation populations include 67 F4/F5 lines from a cross of 27868/Ernie, 120 F4/F5 lines from a cross of 13832/Ernie, 55 DH lines from a cross of Kennedy/Ernie, and 120 F2/F3 lines from a cross of 10903/Ernie.
A barley DH population of 92 lines was used to identify QTL conferring CR resistance and for comparative mapping. The DH population was derived from TX9425 (a Chinese landrace resistant to CR) and Franklin (an Australian variety highly susceptible to CR). A linkage map for this population was constructed using 412 DArT, 80 AFLP and 28 microsatellite markers (Li et al., 2008; 2010b). Three additional populations were developed for validating the effect of the 3H QTL derived from TX9425. The three validation populations used in this study include 74 DH lines from a cross of TX9425/Naso Nijo, 120 F3/F4 lines from a cross of TX9425/Gairdner, and 119 F3/F4 lines from a cross of TX9425/DYSYH.
3.2 Marker genotyping
A total of 34 barley primers and 28 Wheat SSR primers (S-Table 1) from the related genomic regions associated with CR resistance in wheat and barley were screened for polymorphism between parents of the wheat and barley DH populations. Fourteen barley SSR markers showed polymorphism between TX9425 and Franklin, and 11 wheat SSR markers are polymorphic between Ernie and Batavia. These SSRs were amplified using fluorescent dUTPs (Molecular Probes, Eugene, Oregon, USA). Amplification reactions were performed in a total volume of 12.5 μL containing 1× Buffer, 1.5 mM of MgCl2, 0.2 mM of dNTPs, 0.2 μM of unlabeled primer, 0.6 μM fluorescent dUTPs, 0.5 U of Taq polymerase and 20 ng of template DNA. SSR name and amplification conditions were those published in the Genetics supplemental data site: http:/www.genetics.org/cgi/content/full/156/4/1997/DC1. Gel electrophoresis was performed on an automated Gel scanner (Gel-Scan 2000, Corbett Research). Samples were electrophoresed on an 18-cm long 4% polyacrylamide gel containing 7M urea. Allele sizes were calculated by comparison with a 350 (TAMRA) size standard.
3.3 CR screening
A highly aggressive isolate of Fusarium pseudograminearum (Fp3096) collected from Northern New South Wales, Australia (Akinsanmi et al., 2004) was used in this study. The procedures used for inoculum preparation were based on that described by Mitter et al (2006). Specifically, plates of 1/4 strength PDA (potato dextrose agar) inoculated with Fp3096 were incubated for a week at room temperature. The mycelium was scraped and plates were incubated for a further week under a combination of cool white and black (UVA) fluorescent light with a 12-h photoperiod. Macroconidia were harvested, suspended in sterile distilled water after straining through layers of cheesecloth and spore concentration was adjusted to 1×10⁶ spores/mL. Tween 20 was added (0.1% v/v) to the spore suspension prior to use.
CR assay was based on procedures described by Li et al (2008). Seeds were germinated in petridishes on 3-layers of filter paper saturated with water. Newly germinated seedlings were immersed in the conidial suspension (1×10⁶ m/L) for 1 min. Three treated seedlings were sown in a 5 cm×5 cm square punnet (Rite grow kwik pots, www.Gardencityplastics.com, Australia) containing autoclaved potting mix. Three replicates, each containing 15 seedlings in five punnets arranged in a randomised block design, were used. Thirty punnets were placed in each plastic seedling tray for easy handling. After planting, the seedling trays were incubated for 24 h in a humid chamber and then transferred to a glasshouse with 25/15 (±5)°C day/night temperature and 60/80 (±10)% day/night relative humidity (RH). The seedlings were watered only when wilt symptoms appeared. CR severity was assessed at 35 days after inoculation with a 0–5 scale, according to Li et al (2008).
3.4 Linkage and data analysis
Linkage analysis was conducted using JoinMap 4.0 as described by Li et al (2008). A new linkage map were generated for both of the 3H and 3B QTL region, and in order to relocate the CR QTLs based on new linkage maps, a QTL analysis based on same phenotypic data as in the previous studies (Li et al., 2009; 2010) was applied in both of the wheat and barley DH populations using MapQTL 5.0 as described by Li et al (2009). For QTL validation, various numbers of progeny lines were randomly selected from each of the four wheat and three barley validation populations (Table 1; Table 2), and were assessed for CR reaction twice at same condition, one in the controlled environment facility (CEF) and the other in the glasshouses. For each validation population, two replicates, each consisting of 10 individual plants for each line, were used in each screening trial. The average values of CR severity of the 10 plants in each replicate were used in further statistical analyses.
All statistical analyses were performed using GenStat for Windows, 12th edition (copyright Lawes Agricultural Trust, Rothamsted Experimental Station, UK). Homogeneity of variance was tested using Bartlett’s test to determine whether the data could be combined across replicates for further analyses. An analysis of variance was used to detect significant genetic effects for CR severities. Within each trial, the following mixed-effects model was used: Yij=µ+ri+gj+wij. Where: Yij=observation on the jth genotype in the ith replication; µ=general mean; ri=effect due to ith replication; gj=effect due to the jth genotype; wij=error or genotype by replication interaction, where genotype was treated as a fixed effect and that of replicates as random. A general mean across the two trials was calculated for each line and used to analyse the effect of related CR QTL in different populations. Based on the presence or absence of marker alleles from the resistant parents Ernie and TX9425, the lines from each of the populations were grouped into two classes. The difference in CR severity between the two groups within each of the populations was used for measuring the QTL effects.
Authors' Contributions
HBL is the executor of experimental research in this study and took responsibility to make the experimental design, data analysis, paper writing and revising; MXZ and CJL are supervisors of the project and provide the necessary facilities for the research to be performed.
Acknowledgments
The study was carried out at the Laboratory and Glasshouse Facility of Australian CSIRO Plant Industry, St Lucia, QLD 4067, Australia. The Research was Fund by Australian Grains Research & Development Corporation.
References
Ahn S., Anderson J.A., Sorrells M.E., and Tanksley S.D., 1993, Homoeologous relationships of rice, wheat and maize chromosomes, Mol Gen Genet, 241: 483-490
http://dx.doi.org/10.1007/BF00279889
Akinsanmi O.A., Mitter V., Simpfendorfer S., Backhouse D., and Chakraborty S., 2004, Identity and pathogenicity of Fusarium spp. isolated from wheat fields in Queensland and northern New South Wales, Aust J Agric Res, 55: 97-107
http://dx.doi.org/10.1071/AR03090
Bennetzen J.L., and Ramakrishna W., 2002, Numerous small rearrangements of gene content, order and orientation differentiate grass genomes, Plant Mol Biology, 48: 821-827
http://dx.doi.org/10.1023/A:1014841515249 PMid:11999852
Bovill W.D., Ma W., Ritter K., Collard B.C.Y., Davis M., Wildermuth G.B., and Sutherland M.W., 2006, Identification of novel QTL for resistance to CR in the doubled haploid wheat population ‘W21MMT70’ X ‘Mendos’, Plant Breed, 125: 538-543
http://dx.doi.org/10.1111/j.1439-0523.2006.01251.x
Bovill W.D., Horne M., Herde D., Davis M., Wildermuth G.B., and Sutherland M.W., 2010, Pyramiding QTL increases seedling resistance to crown rot (Fusarium pseudograminearum) of wheat (Triticum aestivum), Theor Appl Genet, 121: 127-136
http://dx.doi.org/10.1007/s00122-010-1296-7 PMid:20198470
Burgess L.W., Klein T.A., Liddell C.M., and Brewster C., 1987, Breeding for resistance in wheat to Fusarium graminearum Group 1, In: de Kantzow D.R., and Derera N. (eds.), Breeding Cereals for Disease Resistance, Australian Institute for Agricultural Science, Occasional Publication No.34, pp.62-75
Burgess L., 2005, Intermediate hosts and the management of crown rot and head blight. In: Annual Report of GRDC strategic Initiative on Crown Rot, Common Root Rot and Fusarium Head Blight, Grains Research and Development Corporation, Kingston, Australia, pp.34-36
Chakraborty S., Liu C.J., Mitter V., Scott J.B., Akinsanmi O.A., Ali S., Dill-Macky R., Nicol J., Backhouse D., and Simpfendorfer S., 2006, Pathogen population structure and epidemiology are a key to wheat crown rot and Fusarium head blight management, Plant Pathol, 35: 1-13
Collard B.C.Y., Grams R.A., Bovill W.D., Percy C.D., Jolley R., Lehmensiek A., Wildermuth G., and Sutherland M.W., 2005, Development of molecular markers for crown rot resistance in wheat: mapping of QTL for seedling resistance in a ‘2-49’ x ‘Janz’ population, Plant Breed, 124: 532-537
http://dx.doi.org/10.1111/j.1439-0523.2005.01163.x
Daniel R., and Simpfendorfer S., 2008, The impact of crown rot on winter cereal yields http://www.grdc.com.au/uploads/documents/GRDC%20update%202008%20crown%20rot%20impact%20on%20yield.doc
Devos K.M., and Gale M.D., 1993, Extended genetic maps of the homoeologous group 3 chromosomes of wheat, rye and barley, Theor Appl Genet, 85: 649-652
http://dx.doi.org/10.1007/BF00225000 http://dx.doi.org/10.1007/BF00225020
Dubcovsky J., Luo M-C., Zhong G.Y., Bransteitter R., Desai A., Kilian A., Kleinhofs A., and Dvoiak J., 1996, Genetic map of diploid wheat, Triticum monococcum L., and its comparison with maps of Hordeum vulgare L, Genetics, 143: 983-999
PMid:8725244 PMCid:1207354
Graner A., Jahoor A., Schondelmaier J., Siedler H., Pillen K., Fischbeck G., Wenzel G., and Hermsen R.G., 1991, Construction of an RFLP map of barley, Theor Appl Genet, 83: 250-256
http://dx.doi.org/10.1007/BF00226259
Hohmann U., Graner A., Endo T.R., Gill B.S., and Hermann R.G., 1995, Comparison of wheat physical maps with barley linkage maps for group 7 chromosomes, Theor Appl Genet, 91: 618-626
http://dx.doi.org/10.1007/BF00223288
Islam A.K.M.R., and Shepherd K.W., 1981, Wheat-barley addition lines: Their use in genetic and evolutionary studies of barley. In: Asher M.J.C., Ellis R.P., Hayter A.M., and Whitehouse R.N.H. (eds.), Proc. 4th Int. Barley Genet Symp, Edinburgh Univ. Press, Edinburgh, pp.729-739
Islam A.K.M.R., 1983, Ditelosomic additions of barley chromosomes to wheat. In: Sakamoto S. (eds.), Proc. 6th Int. Wheat Genet Symp, Maruzen, Kyoto, pp.233-238
Islam A.K.M.R., and Shepherd K.W., 1988, Induced pairing between wheat and barley chromosomes. In: Miller T.E., and Koebner R.M.D. (eds.), Proc. 7th Int. Wheat Genet Symp, Institute of Plant Science Research, Cambridge, pp.309-314
Islam A.K.M.R., and Shepherd K.W., 1992, Production of wheat-barley recombinant chromosomes through induced homoeologous pairing. 1. Isolation of recombinants involving barley arms 3HL and 6HL, Theor Appl Genet, 83: 489-494
Klein T.A., Burgess L.W., and Ellison F.W., 1989, The incidence of crown rot in wheat, barley and triticale when sown on two dates, Aust J Exp Agric, 29: 559-563
http://dx.doi.org/10.1071/EA9890559
Li H.B., Vaillancourt R., Mendham N.J., and Zhou M.X., 2008, Comparative mapping of quantitative trait loci associated with waterlogging tolerance in barley (Hordeum vulgare L.), BMC Genomics, 9: 401
http://dx.doi.org/10.1186/1471-2164-9-401 PMid:18752688 PMCid:2533678
Li H.B., Zhou M.X., and Liu C.J., 2009, A major QTL conferring crown rot resistance in barley and its association with plant height, Theor Appl Genet, 118: 903-910
http://dx.doi.org/10.1007/s00122-008-0948-3 PMid:19130031
Li H.B., Xie G.Q., Ma J., Liu G.R., Wen S.M., Ban T., Chakraborty S., and Liu C.J., 2010a, Genetic relationships between resistances to Fusarium head blight and crown rot in bread wheat (Triticum aestivum L.), Theor Appl Genet, 121: 941-950
http://dx.doi.org/10.1007/s00122-010-1363-0 PMid:20535443
Li H.B., Kilian A., Zhou M.X., Wenzl P., Huttner E., Mendham N., McIntyre L., and Vaillancourt R.E., 2010b, Construction of a high-density composite map and comparative mapping of segregation distortion regions in barley, Mol Genet Genomics, 284: 319-331
http://dx.doi.org/10.1007/s00438-010-0570-3 PMid:20803217
Li X.M., Liu C.J., Chakraborty S., Manners J.M., and Kazan K., 2008, A simple method for the assessment of crown rot disease severity in wheat seedlings inoculated with Fusarium pseudograminearum, J Phytopathology, 156: 751-754
http://dx.doi.org/10.1111/j.1439-0434.2008.01425.x
Ma J., Li H.B., Zhang C.Y., Yang X.M., Liu Y.X., Yan G.J., and Liu C.J., 2010, Identification and validation of a major QTL conferring crown rot resistance in hexaploid wheat, Theor Appl Genet, 120: 1119-1128
http://dx.doi.org/10.1007/s00122-009-1239-3 PMid:20035314
Moore G., Devos K.M., Wang Z., and Gale M.D., 1995, Grasses, line up and form a circle, Curr Biol, 5: 737-739
http://dx.doi.org/10.1016/S0960-9822(95)00148-5
Mudge A.M., Dill-Macky R., Dong Y.H., Gardiner D.M., White R.G., and Manners J.M., 2006, A role for the mycotoxin deoxynivalenol in stem colonisation during crown rot disease of wheat caused by Fusarium graminearum and Fusarium pseudograminearum, Physiol Mol Plant Pathol, 69: 73-85
http://dx.doi.org/10.1016/j.pmpp.2007.01.003
Paux E., Sourdille P., Salse J., Saintenac C., Choulet F., Leroy P., Korol A., Michalak M., Kianian S., Spielmeyer W., Lagudah E., Somers D., Kilian A., Alaux M., Vautrin S., Berge`s H., Eversole K., Appels R., Safar J., Simkova H., Dolezel J., Bernard M., and Feuillet C., 2008, A physical map of the 1-gigabase bread wheat chromosome 3B, Science, 322: 101-104
http://dx.doi.org/10.1126/science.1161847 PMid:18832645
Pratchett N., and Laurie D.A., 1994, Genetic map location of the barley developmental mutant liguleless in relation to RFLP markers, Hereditas, 120: 35-39
http://dx.doi.org/10.1111/j.1601-5223.1994.00035.x
Ramsay L., Macaulay M., degli Ivanissevich S., MacLean K., Cardle L., Fuller J., Edwards K.J., Tuvesson S., Morgante M., Massari A., Maestri E., Marmiroli N., Sjakste T., Ganal M., Powell W., and Waugh R., 2000, A simple sequence repeat-based linkage map of barley, Genetics, 156: 1997-2005
PMid:11102390 PMCid:1461369
Sato K., Nankaku N., and Takeda K., 2009, A high-density transcript linkage map of barley derived from a single population, Heredity, 103: 110-117
http://dx.doi.org/10.1038/hdy.2009.57 PMid:19455180
Smiley R.W., Gourlie J.A., Easley S.A., Patterson L.M., and Whittaker R.G., 2005, Crop damage estimates for crown rot of wheat and barley in the Pacific Northwest, Plant Dis, 85: 595-604
http://dx.doi.org/10.1094/PD-89-0595
Somers D.J., Isaac P., and Edwards K., 2004, A high-density microsatellite consensus map for bread wheat (Triticum aestivum L.), Theor Appl Genet, 109: 1105-1114
http://dx.doi.org/10.1007/s00122-004-1740-7 PMid:15490101
Wallwork H., Butt M., Cheong J.P.E., and Williams K.J., 2004, Resistance to crown rot in wheat identified through an improved method for screening adult plants, Aust Plant Pathol, 33: 1-7
http://dx.doi.org/10.1071/AP03073
Wildermuth G.B., and Purss G.S., 1971, Further sources of field resistance to crown rot (G. zeae) of cereals in Queensland, Aust J Exp Agric and Ani Husb, 11: 455-458
http://dx.doi.org/10.1071/EA9710455
Wildermuth G.B., Thomas G.A., Radford B.J., McNamara R.B., and Kelly A., 1997, Crown rot and common root rot in wheat grown under different tillage and stubble treatments in southern Australia, Soil Tillage Res, 44: 211-224
http://dx.doi.org/10.1016/S0167-1987(97)00054-8


. PDF(535KB)
. FPDF
. HTML
. Online fPDF
Associated material
. Readers' comments
Other articles by authors
. H.B. Li
. M.X. Zhou
. C.J. Liu
Related articles
. Wheat
. Barley
. Crown rot
. Validation
. Comparative mapping
Tools
. Email to a friend
. Post a comment