Introduction
The sunflower plant is originated in western North America. It is thought to have been domesticated around 1000 B.C. by Native Americans. Spanish explorers brought the sunflower to Europe in 1510. However, it was not expanded until the late 1800s, when the flower was introduced in the Russian Federation, which the sunflower became a food crop. In 1860, Russian farmers made significant improvements in the way that the sunflower was cultivated. Then, they became the world’s largest producer of sunflower seeds (
FAO, 2011).
Sunflowers grow well in an expanded range of regions, depending on the variety, can be grown in a wide range of climatic conditions. Cultivation of sunflower oil in strongly fluctuates. It is about 30-25 thousand hectares of cultivated area currently produces about 30,000 tons of grain. About 70-50 thousand hectares of cultivated were sunflower nuts in the country. Average yield of irrigated were land under cultivation of hybrid varieties of oil and 1 800 kg per hectare yield in dry land (open pollinated varieties) 1 200 kg ha (
Khajehpour, 2007).
Schoeman to study the interaction of genotype × environment sustainability in the different methods used sunflower and stated that AMMI model not only introduces the stable genotypes, but cannot determine the compatibility of data private.so the AMMI model accurate estimate of the true performance potential of varieties and genotypes are evaluated to provide specific environments (
Schoeman, 2003).
Albert to study the interaction of genotype and environment sustainability analysis to compare the various methods maize hybrids but the stability of AMMI model was introduced in the end the best way to analyze (
Albert, 2004).
Shadpour in order to investigate the interaction of genotype and environment to determine the adaptability and stability of genotypes performance in Rasht and Tirtash region Virginia tobacco in the field of research , were cultured and studied In a randomized complete block design with three replications in two crop years (2008-2010). In this study, the overall genotypes 3 were introduced based on Tai and Eberhart and Russell method as superior genotypes (
Shadpour et al., 2011).
The GGE biplot is a multi-faceted tool in quantitative genetic analyses and plant breeding. In addition to dissecting GEI, GGE Biplot helps analyze genotype-by-trait data, genotype-by-marker data, and diallel cross data (
Yan et al., 2001;
Yan, 2001;
Yan and Hunt, 2000, 2002;
Yan and Sial et al., 2000). These aspects make GGE biplot a most comprehensive tool in quantitative genetics and plant breeding.
Farshadfar et al The objective of this study explored the effect of genotype (G) and genotype × environment interaction (GEI) on grain yield of 16 bread wheat genotypes (Triticum aestivum L.) in five different environments. Yield data were analyzed using the GGE biplot method. Environment (E) explained 59.39% of the total variation. Collective analysis of the biplots suggested three bread wheat mega-environments in Ilam Province. The first mega-environment contained environments: E2 with genotypes B2 and B7. Genotype B9 gave the highest performance in environment E1 and E3 and genotypes B8, B9, B3 and B2 revealed the highest performance in environments E4 and E5. Genotypes B9, B8, B3 and B2 exhibited the highest mean yield and genotypes B6 and B16 displayed the poorest mean yield. The highest stability was attributed to genotypes B8, B10, B16, B1 and B11 (
Farshadfar et al., 2012).
Because each group of researchers have used one way or combination of them in their studies to identify high yielding and stable varieties, The study is intended to determine the stability of genotypes is a fusion of different ways.
1 Material and Methods
So as to study and probe on the stability of the sunflower items, there we selected and prepared 16 genotypes of it (sunflower) ( these species were: Alexandra, Joana, Fabiola, Euroflor, Brocar, Azargol, Arena, Altesse, Almanzor, Alisson, Vidoc, Terra, Pomar, Nkarmoni, Melody, Mas96a) from the investigation on Eugenic of seeds and sapling in Karaj and began a comparable procedure in the form of full random design blocks in 4 iterated measure in 4 regions, Esfahan, Birjand, Sari and karaj and in the cultivation year 2011-2012, the preparation operations of lands included of cleaning of floor (ground), plowing, Disk, tabulation and making gutters and stacks. Every experimental Kurt was formed of 4 rows of plant cultivation with 5 meters long and 80 centimeters width, the distance of bushes was determined 20 centimeters. Amount of the applied seeds was 6 Kilograms in hectare (60 bushes in every squared meter). On the way to eradicate weeds, there we used a mechanical method in all the cultivation running periods until attaining harvest time, and then we used cultivation caregiving support. Finally, all the karts were harvested by hand. Generally, the attributes of seed yield was noted in all time spared on the experiment.
For the purpose of statistical analyses, first of all we applied variance analyses for every region separately and then, the final complex variance implemented. These analyses were operated by means of SAS, GGE Bi plot software and also to analyze pertaining stability statistics gathered, we used NSTAB software.
2 Results and Discussion
After normal data control, pilot error variance homogeneity test was performed using Bartlett. The results of combined analysis of variance for grain yield shows that the effect is significant difference in the level of one percent. So the seeds were in different places. It also suggests the usefulness of analysis for grain yield is sustainable. The effect was significant at the level of one percent. The significance of the effect of the experimental data showed that the reaction was not the same in different regions. In other words, there is considerable variation. According to the results, the effect of environment and genotype × environment interaction was significant at the level of one percent. Significant effects of genotype × environment represent the environmental performance of different genotypes for the other. With respect to the interaction between genotype and environment, analysis of variance unable to explain the stability of genotypes, so using statistical methods, the effect of genotype × environment interaction analysis and review to be stable genotypes identified (
Table 1).
.png)
Table 1 Combined analysis of variance sunflower cultivars studied in 4 locations
Note: **, *, Ns, respectively, indicating no significant difference statistically significant at the 5 and 1 percent level
|
2.1 Results are based on analysis of variance methods
The results of the coefficient of variation (CV
i) showed that the number of Brocar and Nkarmoni cultivars of the lowest coefficient of variation was accounted for. The biological stability and the flexibility are high. Azargol and Nkarmoni cultivars are stable in research based on Francis and Kannenberg’s (
Francis and Kannenberg, 1978) figures. The Arena and Pomar cultivars, respectively, with the highest coefficient of variation and the expression showed the lowest stability.
Eco Valance Rick and Shukla variance statistics the second represents the stability of Lin et al (
Lin et al., 1986) respectively. Based on the results of the variance Shukla, Terra, Vidoc and Alisson cultivars, respectively, the cultivars are stable, according to the minimum variance Shukla.
Lin and Binns (
Lin and Binns, 1988) proposed location between the mean-square methods. They calculated the stability of the isolated location. Coefficient of variation in space Lin and Binns (
Lin and Bins, 1991) is presented as the fourth parameter type (
Table 2).
Table 2 The results based on the analysis of univariate methods for sunflower genotypes studied (yield)
|
2.2 Stability analysis of genotypes based on regression analysis
The Arena and Fabiola cultivars are with regression coefficient close to an above-average yield and average stability and compatibility good. Altesse cultivar is with regression coefficient close to a below average performance and general stability and compatibility poor average. Also, Melody cultivar is with regression coefficient close to a near-average yield with moderate stability and consistency the average public. Euroflor and Joana cultivars are with regression coefficient close to a below average performance and general stability and compatibility poor average. The regression model coefficient of determination (or diagnosis), which has been proposed to improve decision-making based on regression The model and the coefficient of determination is greater than regression model higher. Using this method, Terra and Pomar cultivars were with the highest coefficient of variation as stable genotypes introduced. The regression models Hanson model in this way, how much
Di lower the deviation is less stable and more sustainable cultivars, The Terra and Pomar genotypes were stable with the lowest varieties. And according to the average performance Alisson and Fabiola genotypes can be introduced as stable genotypes. By definition, Euroflor and Almanzor genotypes were introduced unstable genotypes in these models (
Table 3).

Table 3 Finlay and Wilkinson regression parameters of stability for sunflower cultivars investigated
|
2.3 The effect ofgenotype × environment interactionusingmultivariateAMMI
Biplot diagram AMMI1 Almanzor, Altesse and Euroflor genotypes also Sari and Karaj environments were with high IPCA1, In other words, the greatest impact in the creation of their interaction. Vertical line in the middle of biplot out all data passes. Genotypes and locations right out of their line of higher performance, So Nkarmoni, Arena, Alexandra, Vidoc, Altesse, Melody, Pomar, Mas96a, Joana, Fabiola genotypes were respectively the highest to the lowest mean performance is above average, And were the right of the vertical line in the middle biplot (
Figure 1).
.png)
Figure 1 Biplot average yield of sunflower, the environment and the values of the first main component (AMMI1).(S1 to S4, respectively, Birjand, Isfahan, Karaj and Sari G1 to G16 varieties is Alexandra, Alisson, Almanzor, Altesse, Arena, Azargol, Brocar, Euroflor, Fabiola, Joana, Mas96a, Melody, Nkarmoni, Pomar, Terra and Vidoc )
|
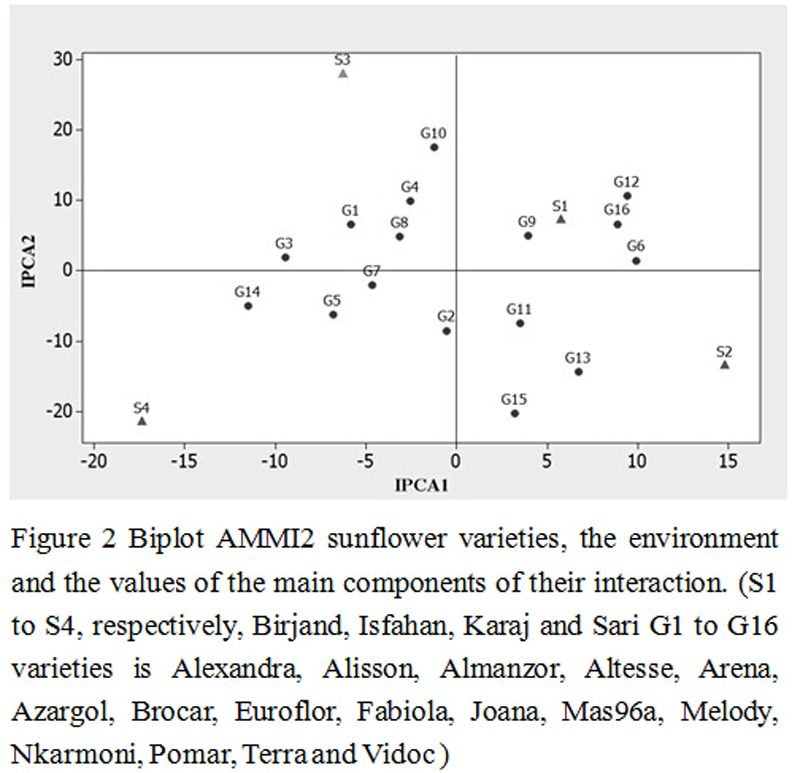
In the chart biplot AMMI2 Euroflor, Alisson, Mas96a, Fabiola genotypes had stable genotypes. Terra cultivar was observed lowest performance in the biplot. Also among the places, Birjand showed high performance in the environment. Karaj locations had the lowest performance. As well as the in Birjand location is cultivar Fabiola and in Isfahan place in the best cultivar is Nkarmoni and to Karaj place is cultivar Joana and to Sari place is cultivar Pomar, respectively Stable component in the survey varieties for grain yield (
Figure 2).
.png)
Figure 2 Biplot AMMI2 sunflower varieties, the environment and the values of the main components of their interaction. (S1 to S4, respectively, Birjand, Isfahan, Karaj and Sari G1 to G16 varieties is Alexandra, Alisson, Almanzor, Altesse, Arena, Azargol, Brocar, Euroflor, Fabiola, Joana, Mas96a, Melody, Nkarmoni, Pomar, Terra and Vidoc )
|
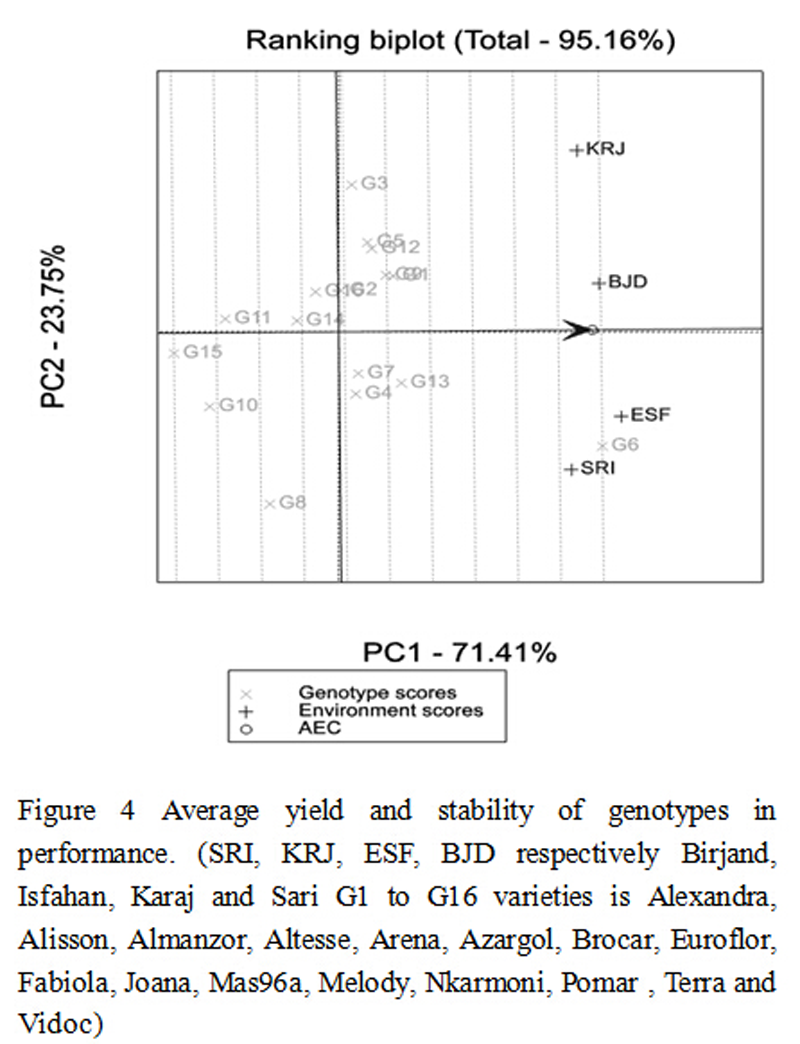
Stability of genotypes multivariate analysis using graphical GGE biplot sunflower cultivars, Determining Mega- environments the best figure in any location Biplot explains the diagram of 95.16% of yield variance of data. In the
Figure 2, 4 parts is created by lines perpendicular to the sides of the polygon can be seen.Placesareneededinthese areas. Other genotypes are (with the exception of the genotypes in vertices) the need to be located within the polygon. Azargol, Arena, Terra, Almanzor cultivars are located in the corners or vertices of the polygon. Karaj and Birjand and Isfahan locations are located part in the Azargol and Almanzor cultivars are located at the top of the section. In fact, such an interpretation of the varieties Almanzor and Azargol were best genotypes for Karaj, Isfahan Birjand locations. Sari place in a part located at the top of the cultivar Azargol, This means that Azargol cultivars best genotype is for the location Sari. The Alisson, Mas96a, Pomar, Vidoc, Terra, Arena genotypes are located in areas that have no place in sectors.
Another feature Biplot is shown that the grouping environment. The point is to identify different Mega- environments. Sari and Isfahan location were formed in the first Mega- environment, Birjand and Karaj also known as the second Mega- environment (
Figure 3).
.png)
Figure 3 Polygon Graph for mega- environments by GGEbiplot in sunflower genotypes. (SRI, KRJ, ESF, BJD respectively Birjand, Isfahan, Karaj and Sari G1 to G16 varieties is Alexandra, Alisson, Almanzor, Altesse, Arena, Azargol, Brocar, Euroflor, Fabiola, Joana, Mas96a, Melody, Nkarmoni, Pomar , Terra and Vidoc)
|
According to
Figure 4, Azargol was the highest performance and Terra was the lowest yield. Average genotypes are as follows:
6>13>9≈1<12<5 <7>4>2<3>16<14<8<11<10<15
The Azargol and Almanzor cultivars showed besides low performance, the largest fluctuations in performance (most volatile), because vertical intervals with the longest line on the horizontal axis. While the Brocar, Alexandra and Fabiola cultivars, After Nkarmoni and Altesse cultivars were stable genotypes. But in terms of the graph of the position were not so good selection.
.png)
Figure 4 Average yield and stability of genotypes in performance. (SRI, KRJ, ESF, BJD respectively Birjand, Isfahan, Karaj and Sari G1 to G16 varieties is Alexandra, Alisson, Almanzor, Altesse, Arena, Azargol, Brocar, Euroflor, Fabiola, Joana, Mas96a, Melody, Nkarmoni, Pomar , Terra and Vidoc)
|
Conclusion
In this experiment, the cultivars Azargol, Nkarmoni, Alexandra and Melody known for stable grain yield and consistent varieties. Also among the places, Birjand showed high performance in the environment.
Karaj locations had the lowest performance. As well as the location of Birjand in the Fabiola cultivar, and in place of the figure, the Nkarmoni cultivar and to place the Joana Karaj cultivar, and to place the Sari Pomar cultivar, respectively, stable component in the survey figures for grain yield.
Albert M.J.A., 2004, A comparison of statistical methods to describe genotype × environment interaction and yield stability in multi-location maize trials. M. Sc. Thesis. Department of Plant Sci., The University of the Free State, Bloemfontein
F.A.O., 2011, Data Stat Year 1988, UN Food and Agriculture Organization. Rome. Italy
Farshadfar E., Poursiahbidi M.M., and Jasemi m., 2012, Evaluation of phenotypic stability in bread wheat genotypes using GGE-biplot, International Journal of Agriculture and Crop Sciences, 4(13): 904-910
Khajehpour M.R., 2008, Industrial plants, University of Esfahan Technology
Shadpour S., Peighambari S.A., and Jahromi M.A., Effect of genotype × environment interaction in tobacco greenhouse by using regression analysis, The first national cnference on issues of modern agriculture, Islamic Azad University, November 2011
Scchoemam L.J., 2003, Genotype × environment interaction in sunflower (Helianthus annuus) in South Africa.M.SC. Thesis, department of agronomy, Faculty of agricultural., university of free state., Bloemfontein.
Sial M.A., Arain M.A., and Ahmad M., 2000, Genotype× Environment interaction on bread wheat grown over multiple sites and years in Pakistan, Pak J Bot, 32(1), 85-91
Yan W., Hunt L.A., Sheng Q., and Szlavnics Z., 2000, Cultivar evaluation and mega-environment investigation based on the GGE biplot, Crop Sci. 40(3): 597-605
Yan W., and Hunt L.A., 1998, Genotype by environment interaction and crop yield, Plant Breed, 16: 135–178
Yan W., and Hunt L.A., 2002, Biplot analysis of multi- environment trial data, In M.S. Kang (ed.), pp. 289-303
Yan W., and Kang M.S., 2003, GGE biplot analysis: a graphical tool for breeders, geneticists and agronomist, CRC Press, Boca Raton, FL. 271pp
Yan W., and Rajcan I., 2002, Biplot analysis of test sites and trait relations of soybean in Ontario, Crop Sci., 42(1): 11–20
Yan W., Tinker N.A., 2005, An integrated system of biplot analysis for displaying, interpreting, and exploring genotype by environment interactions, Crop Sci., 45(3): 1004-1016
Yan W., 2001, GGEbiplot-A Windows application for graphical analysis of multi-environment trial data and other types of two-way data, Agronomy Journal, 93(5): 1111-1118
Yan W., 2002, Singular-value partitioning in biplot analysis of multi-environment trial data, Agronomy Journal, 94(5): 990-996

 Author
  Correspondence author

.png)