Introduction
Physical characteristics of wheat grain
, including grain weight
, dimensions
, shape
, uniformity
, density and texture
, can affect the storage
, transportation
, milling and marketing of bread wheat. Grain hardness is an important quality characteristic of bread wheat that determines the end use properties and market classification of the grain. Wheat is classified into soft, medium soft, hard, medium hard and extra hard on the basis of grain hardness (reviewed in
Pasha et al., 2012).
In soft wheat, the starch granules are loosely bound to the surrounding protein matrix, the soft grains are easy to mill and produce fine-textured flour with a high proportion of undamaged starch granules. In contrast, in the hard wheat there is a tight linkage between the starch granules and protein matrix, hard grains resist mechanical crushing and are more difficult to mill and more energy is needed during milling. Hence, flour with coarser texture is produced with higher proportion of damaged starch granules. Hard wheat is more suitable for yeast-leavened bread because of the higher water absorption of damaged starch, while soft wheat, which has low water absorption due to less protein and starch damage, is ideal for cookies, cakes and pastries(
Lillemo et al., 2006;
Morris and Rose, 1996).
Grain hardness is controlled by one major genetic factor, the hardness locus (
Ha) on the short arm of chromosome 5D. The locus contains two genes Puroindoline a (
Pina) and Puroindoline b (
Pinb) within a region of about 82.0 bp (
Chantret et al., 2005;
Morris, 2002). The
Pina and
Pinb genes code for puroindoline a and puroindoline b proteins
, respectively. These genes confer soft endosperm when they are both in their wild-type allelic states (
Pina-D1a/Pinb-D1a). Hard wheat is the result of mutations in either
Pina or
Pinb (
Morris, 2002). Both genes have various different alleles in hexaploid wheat. Highly conserved mutations in these two genes have been identified and named
Pina-D1b and
Pinb-D1b, the former being a null allele and the latter representing a glycine to serine mutation at position 46 in the puroindoline protein (
Giroux and Morris, 1997; 1998). Several more alleles of
Pina-D1 and
Pinb-D1 have now been identified. Until recently, 17 Pina and 25 Pinb alleles have been reported in hexaploid wheat and related species (Chen et al., 2012; Morris and Bhave, 2008). Recent studies showed that all hardness mutations do not have equal effect of grain texture (Giroux et al., 2000; Martin et al., 2001). Data of allelic contribution of Pina and Pinb indicated that those hard wheats with null allele at Pina loci which lack puroindoline a protein (Pina-D1b /Pinb-D1a) were somewhat harder than those hard wheats that possess a normal soft puroindoline a but have an altered, mutant form of puroindoline b (Pina-D1a /Pinb-D1b) (Morris and Massa, 2003).
Knowledge on the allelic variability of Pina and Pinb genes in representative sets of bread wheat germplasm is of importance for their classification and it can help better explain the nature and different classes of grain hardness. It can also assist wheat breeders to precisely apply this information in a marker-assisted selection program. Therefore, the objective of this study was to characterize some Iranian wheat cultivars for the allelic distribution of puroindoline genes and to study their association with grain quality characteristics.
1 Results and Discussion
1.1 Grain quality related traits
The descriptive statistics for grain quality traits, measured with the NIR, showed that the average of grain protein content was 12.81% with the range of 11.5-14.0 in the studied wheat cultivars. The mean of hardness index of the grains was 50.41 with the variation range of 44.0-58.0. Zeleny number was obtained with an average of 35.09 and variation range of 32.0-40.0. Bread volume had the average of 498.4 with the variation range from 450 to 570 values. (
Table 1). The phenotypic coefficient of variations for traits showed the existence of variations between the studied wheat cultivars, except for water absorption with 1.3%.Bivariate correlation analysis showed that grain hardness had a positive correlation with protein content (r = 0.59, p < 0.0001) and Zeleny number (r = 0.57, p < 0.0001) that is consistent with the reports of
Grosse et al. (2004). According to these reports, significantly positive correlation was observed between grain protein content and grain hardness (
Table 2). A significantly positive correlation was also observed between Zeleny number and protein content (r = 0.87, p < 0.0001), which was accordance with the results of
Shevery and Tatham (2000), where grain protein content had a positive correlation with Zeleny number. It can be concluded that the harder grains had more water absorption. The correlation analysis of the studied traits showed that the water absorption had significantly positive correlation with protein content (r = 0.42, p < 0.0001), Zeleny number (r = 0.38, p < 0.001) and grain hardness (r = 0.23, p < 0.05).
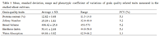
Table 1 Mean, standard deviation, range and phenotypic coefficient of variations of grain quality related traits measured in the studied wheat cultivars.
|
.png)
Table 2 Bivariate correlation analysis for some quality related traits in wheat cultivars. Protein content (PROT), Zeleny Number (ZELL), Bread Volume (BV), Hardness Index (HI), Water Absorption (WA)
|
Hard texture wheat had higher protein and more intensive gluten and thus higher bread quality compared to soft texture wheat (Bushuk, 1998; Tipples et al., 1994). High protein content and hard grains would produce courser flour with more damaged starch, consequently lead to higher water absorption.
1.2 Pina and Pinb alleles
A set of co-dominant STS primers (
Huang and Brûlé-Babel, 2011) for identification of the puroindoline a alleles, amplified two specific bands of 447 and 625 bp (
Figure 1) for
Pina-D1a and
Pina-D1b alleles, respectively. In this study,
Pina-D1a allele was observed in 64% of the cultivars (54), while
Pina-D1b allele was observed in 36% of the studied cultivars (30).
.png)
Figure 1 The STS primers of Pina-F1c، Pina-R1b، Pina-R2a amplified fragments of 447 bp and 625 bp from for Pina-D1a and Pina-D1b alleles at the puroindoline a locus, respectively. The lanes from 1 to 11 representing cultivars of Darya, Arg, Rooshan, Dez, Zarrin, Tajan. Pishtaz, Chamran, Kohdasht, Kavir and Maroon, respectively.
|
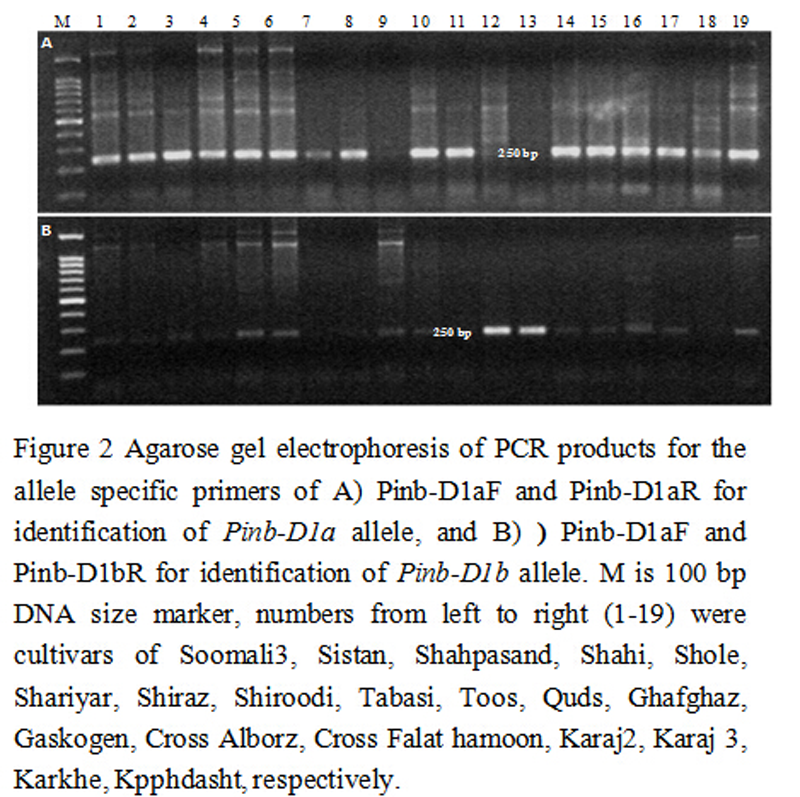
However, primers used for identification of alleles in the
Pinb locus amplified a band of 250 bp for
Pinb-D1a and
Pinb-D1b alleles (
Figure 2).
Pinb-D1a allele was observed in 90% of the cultivars (76), while only 10% of the cultivars (8) represented the
Pinb-D1b allele. None of the alternative mutations in puroindoline b (
Pinb-D1c-d) was detected in the studied wheat cultivars.
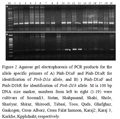
Figure 2 Agarose gel electrophoresis of PCR products for the allele specific primers of A) Pinb-D1aF and Pinb-D1aR for identification of Pinb-D1a allele, and B) ( Pinb-D1aF and Pinb-D1bR for identification of Pinb-D1b allele. M is 100 bp DNA size marker, numbers from left to right (1-19) were cultivars of Soomali3, Sistan, Shahpasand, Shahi, Shole, Shariyar, Shiraz, Shiroodi, Tabasi, Toos, Quds, Ghafghaz, Gaskogen, Cross Alborz, Cross Falat hamoon, Karaj2, Karaj 3, Karkhe, Kpphdasht, respectively.
|
In general, 56% of the cultivars had the wild type alleles (
Pina-D1a and
Pinb-D1a) at both loci (
Table 3). 34.5% of the cultivars showed the mutation allele at puroindoline a locus (
Pina-D1b), but the wild type allele at the puroindoline b locus. The cultivars with
Pina-D1a and
Pinb-D1b were about 8.3% (7), while only one cultivar was found to have mutation alleles at both loci (
Pina-D1b/Pinb-D1b).
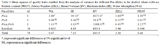
Table 3 Mean squares of quality traits resulted from the analysis of variance for different Pin alleles in the studied wheat cultivars. Protein content (PROT), Zeleny Number (ZELL), Bread Volume (BV), Hardness Index (HI), Water Absorption (WA)
Note: *, represent significant differences at 5% significant level
NS, represent non-significant differences
|
1.3 Marker-trait association
The results of unbalanced analysis of variance for the quality traits as variate and the
Pin alleles as factors (
Table 4) showed that only
Pina had a significant effect on grain hardness (p = 0.019), water absorption (p = 0.015) and bread volume (p = 0.012).
Pinb and the interaction between
Pina and
Pinb had not significant effects on grain quality traits. Mean comparison between different alleles at the
Pina and
Pinb genes as well as allelic combinations at both loci showed that cultivars with the Pina-null allele (
Pina-D1b) had significantly higher grain hardness (51.34 ± 0.48) relative to those with the wild-type (
Pina-D1a) allele (49.88±0.36). At this locus, cultivars with
Pina-D1b allele had also significantly higher water absorption (64.95±0.14) and relatively smaller bread volume relative to
Pina-D1a allele (
Table 5). Although, F-statistic for allelic combinations showed no significant differences, p-value for HI, WA and BV were 0.09, 0.08 and 0.07, respectively. Cultivars having wild-type alleles at both loci (
Pina-D1a/Pinb-D1a) had relatively smaller grain hardness (49.76 ± 0.4), while cultivars bearing either mutant alleles at each locus or both loci showed relatively higher harness index (
Table 5).
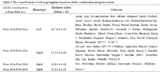
Table 4 The classification of wheat germplasm based on allelic combination and grain texture
|
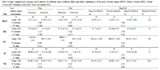
Table 5 Means, standard error of means and F-statistics for different traits at different alleles and allelic combinations of Pin genes. Protein content (PROT), Zeleny Number (ZELL), Bread Volume (BV), Hardness Index (HI), Water Absorption (WA)
|
2 Conclusion and Discussion
In this study, 84 wheat cultivars were characterized for the major alleles of
Pina and
Pinb genes. The most frequent allele was
Pinb-D1a and the second most frequent allele was
Pina-D1a. This result suggests that most of the wheat cultivars were soft grain, with allelic combination of
Pina-D1a/Pinb-D1a at both loci. The
Pina-D1b (Null mutation) allele was the most frequent grain hardness allele which observed in 36% of the cultivars. The hardness allele of
Pinb-D1b was observed only in 10% of the studied wheat cultivars.
Lillemo et al. (2006) also found the
Pina-D1b as the most frequent hardness allele which presented in 283 of the 328 lines with hard endosperm. A study of historically important CIMMYT bread wheat lines showed that
Pina-D1b has been the dominating hardness allele since the inception of the wheat breeding program in Mexico (
Lillemo et al., 2006).
Mohammadi et al. (2013) reported
Pina-D1a/Pinb-D1a allelic combinations as the most frequent genotypes.
The most second frequent genotype was
Pina-D1b/Pinb-D1a genotypes. However,
Cane et al. (2004) reported that the
Pinb-D1b allele was the major determinant of hardness in southern Australian wheat germplasm, so that, this allele was found in 84% of the cultivars and breeding lines (
Cane et al., 2004). The
Pinb-D1b allele has been the most frequent hardness allele in hard wheat cultivars in North American and northern European germplasm (
Lillemo and Morris, 2000;
Morris et al., 2001). Whereas the
Pinb-D1b allele prevails among the spring and winter wheats of North America, Europe, China and Australia (
Cane et al., 2004;
Lillemo and Morris, 2000;
Morris et al., 2001;
Xia et al., 2005),
Pinb-D1c and
Pinb-D1d were mostly found in Western Europe (
Lillemo and Morris, 2000). Likewise, the
Pina-D1b has been found to be the primary cause of hardness in Iranian and Indian wheat (
Mohammadi et al., 2013;
Ram et al., 2002).
Based on unbalanced analysis of variance to identify marker-trait association,
Pina had a significant effect on grain hardness, water absorption and bread volume. In this study, cultivars with the
Pina-D1a allele were significantly harder with more water absorption and less bread volume. Several studies have indicated that cultivars with Pina-null alleles (
Pina-D1b) are usually harder than those of
Pinb-D1b in bread wheat, so that
Pina-D1b allele gives slightly harder endosperm than
Pinb-D1b, and is associated with lower milling yield and higher water absorption compared to
Pinb-D1b (
Cane et al., 2004;
Chen et al., 2013;
Chen et al., 2006;
Giroux et al., 2000;
Lillemo et al., 2006;
Martin et al., 2001).
Morris and Massa (2003) have also reported that Among the hard red spring wheat cultivars that possess the
Pina-D1b (a-null) hardness allele were harder than the hard red winter wheat cultivars that possess the
Pinb-D1b allele based on NIR, PSI, and break flour yield.
Malekzadeh et al. (2008) have reported that among Iranian wheats, those possessing
Pina-D1b allele represented a higher hardness value than those with
Pinb-D1b allele. However,
Pina-D1b may be less preferable from a milling standpoint as well as processing quality. Genotypes with
Pina-D1b alleles may have a relatively inferior processing quality for steamed bread, pan bread, and Chinese noodles than the
Pinb-D1b genotype (
Chen et al., 2007;
Chen et al., 2012).
The results of this study showed that the wild type alleles (Pinb-D1a and Pina-D1a) had the highest allelic frequency, while mutant alleles (Pina-D1b and Pinb-D1b) representing hardness characteristic were less frequent in the tested wheat cultivars. Among hardness alleles, Pina-D1b was observed in 36% of cultivars, while only 10% of the wheat cultivars possessed Pinb-D1b. According to marker-trait association analysis, hard wheat cultivars having Pina-D1b (null-mutant allele) were harder in grain texture, with more water absorption and lesser bread volume. The use of STS diagnostic markers is a simple and reliable method to characterize wheat germplasms for Pina and Pinb allelic variability and distribution. The result of this study provides useful information for this set of wheat cultivars, which can be used in the future MAS wheat quality improvement programs.
3 Materials and Methods
3.1 Plant materials and DNA extraction
A total of 84 wheat cultivars were planted at the experimental field of Faculty of Agriculture, University of Birjand, Iran, in the 2013-14 cropping season according to local management practices. At the stage of tillering, leaf samples of each individual were collected and snap-frozen in liquid nitrogen then stored at -20°C. After harvest, about 50 g of bulked clean seeds from each individual were used to measure grain quality traits including grain hardness, protein content, Water absorption, bread volume, Zeleny Number using the near-infrared reflectance (NIR) spectroscopy (Inframatic No. 8100) on ground grain (
Method 39-70A in AACCI, 2002).
Extraction of DNA was performed according to the method of
Pallotta et al. (2003) with minor modifications. The quality and quantity of the extracted DNA was assessed using NanoDrop 2000 spectrophotometer (Thermo Scientific).
3.2 PCR amplification of Pina and Pinb
The
Pina alleles were amplified using a set of co-dominant STS primers (
Table 6) described by (
Huang and Brûlé-Babel, 2011) yielding products of ~447 bp and ~625 bp for
Pina-D1a and
Pina-D1b alleles, respectively. The
Pinb-D1a and
Pinb-D1b alleles were identified using allele specific primers that amplify a fragment of about 250 bp (
Giroux and Morris, 1997; 1998).
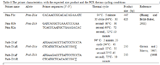
Table 6 The primer characteristics with the expected size product and the PCR thermo cycling conditions
|
PCR amplifications were performed in an Eppendorf gradient thermocycler. PCR reactions were carried out in 20 μL volume containing 2 μL of 10X PCR buffer, 1.5 mM MgCl2, 0.4 mM of each dNTP, 1 U of Taq DNA polymerase and ~100 ng of genomic DNA. Thermal cycling conditions for the primer pairs are presented in
Table 6. PCR products were separated on 1.5% agarose gel.
3.3 Statistical analysis
The statistical analysis was performed to estimate the effects of the puroindoline genes on grain quality traits and to identify effective alleles on quality traits. In order to compare the effects of different alleles on the quality related traits, the unbalanced analysis of variance was carried out by GenStat release 12.1 (
Payne et al., 2009). Grain quality related traits were considered as varieties and
Pin alleles and allelic combinations were considered as factors.
AACCI., 2002, Approved Methods of Analysis, 11th Ed, Method 39-70.02, Near-Infrared Reflectance Method for Hardness Determination in Wheat, Approved in
Cane K., Spackman M., and Eagles H.A., 2004, Puroindoline genes and their effects on grain quality traits in southern Australian wheat cultivars, Australian Journal of Agricultural Research, 55(1): 89-95
http://dx.doi.org/10.1071/AR03108
Chantret N., Salse J., Sabot F., Rahman S., Bellec A., Laubin B., Dubois I., Dossat C., Sourdille P., and Joudrier P., 2005, Molecular basis of evolutionary events that shaped the hardness locus in diploid and polyploid wheat species (Triticum and Aegilops), The Plant Cell, 17(4): 1033-1045
http://dx.doi.org/10.1105/tpc.104.029181
Chen F., Li H., and Cui D., 2013, Discovery, distribution and diversity of Puroindoline-D1 genes in bread wheat from five countries (Triticum aestivum L.), BMC Plant Biology, 13(1): 125
http://dx.doi.org/10.1186/1471-2229-13-125
Chen F., He Z., Chen D., Zhang C., and Xia X., 2007, Influence of puroindoline allele on milling, steamed bread, noodles and pan bread in common spring wheat, J Cereal Sci, 45(1): 59-66
http://dx.doi.org/10.1016/j.jcs.2006.06.006
Chen F., Zhang F.Y., Xia X.C., Dong Z.D., and Cui D.Q., 2012, Distribution of puroindoline alleles in bread wheat cultivars of the Yellow and Huai valley of China and discovery of a novel puroindoline a allele without PINA protein, Molecular Breeding, 29(2): 371-378
http://dx.doi.org/10.1007/s11032-011-9553-2
Chen F., He Z.H., Xia X.C., Xia L.Q., Zhang X.Y., Lillemo M., and Morris C.F., 2006, Molecular and biochemical characterization of puroindoline a and b alleles in Chinese landraces and historical cultivars, Theoretical And Applied Genetics, 112(3): 400-409
http://dx.doi.org/10.1007/s00122-005-0095-z
Giroux M., and Morris C., 1997, A glycine to serine change in puroindoline b is associated with wheat grain hardness and low levels of starch-surface friabilin, Theoretical And Applied Genetics, 95(5-6): 857-864
http://dx.doi.org/10.1007/s001220050636
Giroux M.J., and Morris C.F., 1998, Wheat grain hardness results from highly conserved mutations in the friabilin components puroindoline a and b, Proceedings of the National Academy of Sciences, 95(11): 6262-6266
http://dx.doi.org/10.1073/pnas.95.11.6262
Giroux M.J., Talbert L., Habernicht D.K., Lanning S., Hemphill A., and Martin J.M., 2000, Association of puroindoline sequence type and grain hardness in hard red spring wheat, Crop Science, 40(2): 370-374
http://dx.doi.org/10.2135/cropsci2000.402370x
Groos C., Bervas E., and Charmet G., 2004, Genetic analysis of grain protein content٫ grain hardness and dough rheology in hard-hard bread wheat progeny, Journal of Cereal Science, 40(2): 93-100
http://dx.doi.org/10.1016/j.jcs.2004.08.006
Huang X.Q., and Brûlé-Babel A., 2011, Development of simple and co-dominant PCR markers to genotype puroindoline a and b alleles for grain hardness in bread wheat (Triticum aestivum L.), Journal of Cereal Science, 53(3): 277-284
http://dx.doi.org/10.1016/j.jcs.2011.01.008
Lillemo M., and Morris C.F., 2000, A leucine to proline mutation in puroindoline b is frequently present in hard wheats from Northern Europe, Theoretical And Applied Genetics, 100(7): 1100-1107
http://dx.doi.org/10.1007/s001220051392
Lillemo M., Chen F., Xia X., William M., Pe-a R.J., Trethowan R., and He Z., 2006, Puroindoline grain hardness alleles in CIMMYT bread wheat germplasm, Journal of Cereal Science, 44(1): 86-92
http://dx.doi.org/10.1016/j.jcs.2006.03.004
Malekzadeh K., Shahriari F., Farsi M., and Mohsenifard E., 2008, Allelic Variation of Hardness Genes (puroindoline a and b) in Iranian Commercial and Landrace Wheats, JWSS - Isfahan University of Technology, 12(45): 649-656
Martin J., Frohberg R., Morris C., Talbert L., and Giroux M., 2001, Milling and bread baking traits associated with puroindoline sequence type in hard red spring wheat, Crop Science, 41(1): 228-234
http://dx.doi.org/10.2135/cropsci2001.411228x
Mohammadi M., Mehrazar E., Izadi-Darbandi A., and Najafian G., 2013, Genotype Diversity of Puroindoline Genes (Pina-D1 and Pinb-D1) in Bread Wheat Cultivars Developed in Iran and CIMMYT, Journal of Crop Improvement, 27(4): 361-375
http://dx.doi.org/10.1080/15427528.2013.775988
Morris C.F., and Massa A.N., 2003, Puroindoline genotype of the US national institute of standards & technology reference material 8441, wheat hardness, Cereal chemistry, 80(6): 674-678
http://dx.doi.org/10.1094/CCHEM.2003.80.6.674
Morris C.F., Lillemo M., Simeone M.C., Giroux M.J., Babb S.L., and Kidwell K.K., 2001, Prevalence of puroindoline grain hardness genotypes among historically significant North American spring and winter wheats, Crop Science, 41 (1): 218-228
http://dx.doi.org/10.2135/cropsci2001.411218x
Pallotta M.A., Warner P., Fox R.L., Kuchel H., Jefferies S.J., and Langridge P., 2003, Marker assisted wheat breeding in the southern region of Australia, in, Proceedings of the Tenth International Wheat Genetics Symposium Paestum, Italy. pp. 789-791
Payne R., Harding S., Murray D., Soutar D., Baird D., Welham S., Kane A., Gilmour A., Thompson R., Webster R., and Tunnicliffe W.G., 2009, GenStat Release 12.1, in, VSN International Hemel Hempstead, UK
Ram S., Boyko E., Giroux M.J., and Gill B.G., 2002, Null mutation in puroindoine a is present in Indian wheats: puroindoline genes are located in the distal part of 5DS, J. Plant Biochem. Biotech., 11(2): 79-83
http://dx.doi.org/10.1007/BF03263140
Shewry P.R., and Tatham A.S., 2000, Wheat, The Royal Society of Chemistry, Cambridge,
Tipples K.H., Kilborn R.H., and Preston K.R., 1994, Bread-wheat quality defined, in: W. Bushuk and V. F. Rasper (Eds.), Wheat: Production, Properties and Quality, Glasgow, Chapman and Hall, pp. 25-35
http://dx.doi.org/10.1007/978-1-4615-2672-8_3

 Author
  Correspondence author
.png)