1. Department of Genetics and Plant Breeding, UAS, GKVK, Bangalore – 560 065, India
2. Department of Agronomy, Agricultural College, UAS, Dharwad, 580 005, India
3. Agicultural Research Station, Hebballi Farm, UAS, Dharwad, 580 007, India

Author

Correspondence author
Molecular Plant Breeding, 2013, Vol. 4, No. 10 doi: 10.5376/mpb.2013.04.0010
Received: 01 Feb., 2013 Accepted: 07 Feb., 2013 Published: 18 Feb., 2013
The research work comprising of genetic variability, heritability and genetic advance study for seed cotton yield and its components in segregating F2 generation of cotton (Gossypium hirsutum L.) was carried out during 2011 at the Main Agricultural Research Station, University of Agricultural Sciences, Dharwad, India. Genetic potential of segregating F2 generation for different parameters revealed plant height (39 cm to 145 cm), bolls plant per plant (8 to 41), boll weight (2.07 g to 5.29 g) and seed cotton yield per plant (25.19 g to 136.8 g). Genetic variances were found almost greater than the environmental variances for all the traits. High broad sense heritability and genetic gain were recorded for plant height (0.84 cm, 24.71 cm), bolls plant per plant (0.81, 8.04), boll weight (0.78 g, 1.02 g) and seed cotton yield per plant (0.87 g, 34.06 g), respectively. These results suggest that rigorous plant selection is required to identify desirable plants from F2 generation.
Cotton is one of the most important commercial crops which has occupied importance from historic days. Cotton is a crop of prosperity having a profound influence on men, and matter. It is an industrial commodity of worldwide importance. It occupies the place of pride in Indian agriculture and economy by earning valuable foreign exchange. It is primarily used in textile industries providing highest employment during production, processing, spinning, weaving and marketing throughout the world.
Cotton is a unique crop where many potential varieties have been developed and at the same time success of commercial exploitation of heterosis in cotton can be compared to that of maize. Generally believed that loci’s showing high degree of dominance and up to complete dominance responds well to exploitation of heterosis. In contrast with this, the loci mainly showing additive gene action and also those loci showing up to partial dominance and complete dominance respond to varietal develop- ment (Patil, 2011).
Creating genetic variability is pre-requisite for plant breeders to exercise selection, as a part of continuous variation is due to heredity (Galton, 1989). The phenotypic and genotypic coefficients of variation were estimated using genotypic and phenotypic variances respectively. The coefficient of variation indicates only the extent of variability existing for various traits, but does not give any information about the heritable portion of it. Therefore, heritability accompanied by estimates of genetic advance and genetic advance as per cent mean were also estimated.
In the light of this it is interesting to know about what is the extent of utility of lines derived from most potential crosses derived from different studies. Should the lines derived from such crosses be useful only as parents of hybrids or can also be useful as varietal lines? Based on this view point; in the present study, the potential cross CCHH–9 owing their productivity to boll number and boll weight were identified and evaluated for variability parame- ters in segregating generation.
Results and Discussion
The mean, variance and coefficient of variabilities based on the data of individual plant observation for four characters in F1 and in their F2 were presented in Table 1. All the four characters in F2 population recorded higher coefficient of variability compared to their respective F1 population. The data obtained from individual plant observations for four characters of F2 population was utilized for estimating different variability parameters, broad sense heritability and genetic advance. The results pertaining to these aspects are presented in Table 2.
.png)
Table 1 Mean variance and coefficient of variability of characters in F1’s and in their F2 populations inupland cotton (G. hirsutum L.) |
.png)
Table 2 Variability parameters in segregating F2 populations of upland cotton (G. hirsutum L.) |
Plant height exhibited a large magnitude of variance, wide range (39 cm to 145 cm), (Figure 1A) phenotypic variance (198.93) and genotypic variance (167.57) as well as phenotypic co-efficient of variation (12.9) and genotypic co-efficient of variation (11.84) was observed. In general, the differences between genotypic co-efficient of variation and phenotypic co-efficient of variation values were smaller indicating low effect of environment on expression of this character. Plant height had low to moderate GCV and PCV values for all the populations. These results are in accordance with results of Krishnarao and Mary (1990), Deshpande and Baig (2003), Leela Pratap (2006), Kaushik and Kapoor (2006), Kale et al (2007), and Eswar (2008). On the other hand Neelam and Patdukhe (2002) noticed high estimates of GCV and PCV for plant height. Low to moderate GCV and PCV values for plant height indicate the influence of the environment on this trait and also limited scope of selection for improvement of this character. There was highest h2bs (0.84) and using 5% selection intensity, the expected response to selection for plant height was 24.47 in the F2 generation, GAM was about (22.39%). Plant height is very important trait and has close association with bolls per plant (if no lodging occurred) and has ultimate positive effect on seed cotton yield. High h2 with expected response to selection also revealed that the genetic variances play important role in inheritance and establishment of the said trait.
.png)
Figure 1 Population distribution of Plant height, Number of bolls per plant, boll weight and seed cotton yield per plant in F2 segregating generation of Upland Cotton (Gossypium hirsutum L.) |
Number of bolls exhibited the mean of 22.72 and wide ranges (8 to 41) (Figure 1B). The phenotypic variance (23.42), genotypic variance (18.89), h2bs was of greater magnitude (0.81) and using 5 per cent selection intensity, the expected response to selection for bolls per plant was 8.04 in segregating generation.
The range observed for boll weight was wide (2.07 g to 5.29 g) with the population mean boll weight (3.12 g) (Figure 1C). The phenotypic variance and genotypic variance for boll weight were 0.32, 0.41, respectively. The h2bs for boll weight was 0.78, while the genetic advance or gain was 1.02 g under 5%. In general, the differences between genotypic co-efficient of variation and phenotypic co-efficient of variation values were smaller indicating that environment as less effect on expression of this character. Boll weight is second major yield component after number of bolls per plant and have a greater contribution in enhancement of seed cotton yield.
A F2 segregating population exhibited wide range (25.19 g to 136.8 g) for seed cotton yield per plant (g) (Figure 1D). The mean for this trait was 70.43. The phenotypic variance and genotypic variances were 356.94 and 312.40, respectively. There were no much differences between phenotypic co-efficient of variation and genotypic co-efficient of variation observed. Consequently, estimate of h2bs for seed cotton yield per plant was 0.87 and genetic advance under 5% selection intensity was 34.06 g.
Although range can provide a preliminary idea about the variability but coefficient of variation is reliable as it is independent of unit of measurement. The extent of variability as measured by PCV and GCV also gives information regarding the relative amount of variation in different populations. The phenotypic coefficient of variation (PCV) and genotypic coeffic- ient of variation (GCV) showed wide variation for the characters studied. Similar results were reported by Krishnarao and Mary (1990), Neelam and Patdukhe (2002), Kaushik and Kapoor (2006), Kale et al (2007), Sakthi et al (2007).
It is not the magnitude of variation but the extent of heritable variation, which matters most for achieving gains in selection programme. The coefficient of variation indicates only the extent of variation for a character and does not discriminate the variability into heritable and non-heritable portion. The heritability worked out in broad sense would suggest how far the variation is heritable and selection is effective. Though the heritability estimates are the true indicators of genetic potentiality of the genotypes which can be used as a tool for selection, changes in the values of the heritability due to fluctuations of the environmental factors detract for total dependence on such estimates. However, heritability estimates when considered in conjunct- tion with the predicted genetic gain form a reliable tool for selection. They indicate the expected genetic advance of a character in response to the certain selection pressure imposed on them.
Statistical Analysis
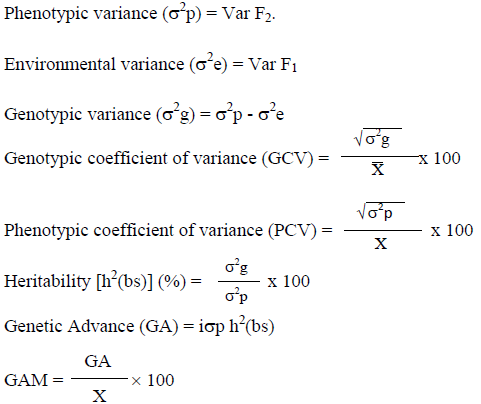
The mean and variances were analyzed based on the formula given by Singh and Chaudhary (1977). Genotypic and phenotypic variances and coefficients of variance were computed based on mean and variance calculated by using data of unreplicated treatments. The genotypic and phenotypic coefficient of variation was computed according to Burton and Devane (1953). The extent of genetic advance to be expected from selecting five per cent of the superior progeny was calculated using the following formula (Robinson et al., 1955).
Where, Var F2 =variance of F2 population; Var F1= variance of corresponding F1; s2p=Phenotypic variance; s2e=Environmental variance; X=General mean of the character; i=Intensity of selection; sp=Phenotypic standard deviation; h2(bs)=Heritabi- lity in broad sense
Materials and Methods
The plant material used in the present investigation derived from a F1 family developed by crossing RC 7×RC 68 cultivar of Gossypium hirsutum L. The cross was advanced to F2 generation and evaluated for variability parameters during 2011 at the Main Agricultural Research Station, University of Agricultural Sciences, Dharwad, India. Each of the F1 and F2 plants spaced 60 cm and 30 cm within, respectively and 90 cm between the rows. The seeds were dibbled to ensure uniform plant population. All the recommended agronomic practices and plant protection measures were adopted to obtain healthy plants. For measurement of mean, variability and other parameters, 200 plants from F2 populations and 16 plants from each F1’s were selected for recording the following observations viz., Seed cotton yield per plant (g), Plant height(cm), Number of bolls per plant and Boll weight.
Authors'contributions
The author conducted the major part of this study including experimental design, data analysis and manuscript preparation. H. M. Ranganatha and Shreekant S. Patil participated in experimental design and preliminary analysis of data. Manjula, S. Maralappanavar carried out stastical analysis and B. N. Arvind Kumar did final data analysis, tables and manuscript preparation. All authors read and approved the final manuscript.
Burton G.W., and Devane E.M., 1953, Estimating heritability in fall fescue (Festecd cirunclindcede) from replicated clonal material, Agron. J., 45: 478-481, http://dx.doi.org/10.2134/agronj1953.000219620045001000 05x
DeshpandeL.A. and Baig K.S., 2003, Combining ability analysis for yield, economic and morphological traits in American cotton (Gossypium hirsutum L.), J. Res., Acharya N. G. Ranga Agric. Univ., 31(3): 28-34
Eswar G., 2008, Genetic divergence in cotton (Gossypium hirsutum L.), M. Sc. (Agri.) Thesis, Acharya N. G. Ranga Agric. Univ., Rajendranagar, Hyderabad
Gururajan K.N., and Sundar S., 2004, Yield component analysis in American cotton. Paper presented in Int. Symp. on “Strategies for Sustainable Cotton Production – A Global Vision”held at University of Agricultural Sciences, Dharwad., 23rd – 25th November, 2004
Kale U.R., Kalpande S., Annapurve S.N. and Gite V.K., 2007, Yield components analysis in American cotton (Gossypium hirsutum L.), Madtas Agric. J.,94(7-12) : 156-161
Kaushik S.K., and Kapoor C.J., 2006, Genetic variability and association study for yield and its component traits in upland cotton (Gossypium hirsutum L.), J. Cotton Res. Dev., 20(2): 185-190
Krishnarao K.V. and Mary T.N., 1990, Variability correlation and path analysis of yield and fibre traits in upland cotton, Madras Agric. J.,77(3&4): 146-151
Laxman S. and Ganesh M., 2003, Combining ability for yield components and fibre characters in cotton (Gossypium hirsutum L.), J. Res., Acharya N. G. Ranga Agric. Univ., 31(4): 19-23
Leela Pratap K., 2006, Combining ability and heterosis in cotton (Gossypium hirsutum L.). M. Sc. (Agri.) Thesis, Acharya N. G. Ranga Agric. Univ., Rajendranagar, Hyderabad
Neelam G. D. and PotdukheN. R., 2002, Studies on variability and correlations in upland cotton for yield and its components, J. Indian Soc. Cotton Improv., 27(3): 148-152
Neelima S., Chenga R.V. and Narisireddy A., 2008, Genetic parameters of yield and fibre quality traits in American cotton (Gossypium hirsutum L.). Indian J. Agric. Res., 42(1): 67-70
Neelima S., Chengareddy, and Narisi Reddy A., 2005, Association and path analysis in American cotton (Gossypium hirsutum L.), J. Indian Soc. Cotton Improv.,30: 53-58
Robinson H.E., Comstock R.E. and Harvay P.H., 1951, Genotypic and phenotypic correlations in corn and their implications in selection, Agron. J., 43: 282-287, http://dx.doi.org/10.2134/agronj1951.0002196 2004300060007x
Sakthi A.R., Kumar M. and Ravikesavan R., 2007, Variability and association analysis using morphological and quality traits in cotton (Gossypium hirsutum), J. Cotton Res. Dev.,21(2): 148-152
Singh R.K., and Chaudhary B.D., 1977, Biometrical Methods in Quantitative Genetic Analysis, Kalyani Publishers New Delhi
Tuteja O.P., Mahender S., Verma S.K. and Khadi B.M., 2006b, Introgressed lines as source for improvement of upland cotton (Gossypium hirsutum L.) genotypes for yield and fibre quality traits, Indian J. Genet. Plant Breed., 66(3): 251-252
Patil S.S., 2011, Importance of teaching concepts of population genetics in effective understanding of plant breeding, Indian J. Genet. Plant Breed., 71(2): 106-114

.png)