Research Article
Genetic Variations in Field Condition Clonally Replicated Sugarcane (Saccharum officinarum L.) Cultivars on the Basis of Morphological and Quality Traits 
2 Department of Plan Breeding and Genetics, The University of Agricultural, Peshawar, Pakistan
3 Plant Genetic Resource Institute, National Agriculture Research Center( NARC), Islamabad, Pakistan
4 Department of Medical Biochemistry and Molecular Biology; and Plant Science and General Agriculture, Carbondale, Illinois, 62901, Pakistan
 Author
  Correspondence author
Plant Gene and Trait, 2016, Vol. 7, No. 5 doi: 10.5376/pgt.2016.07.0005
Received: 11 May, 2016 Accepted: 30 Jun., 2016 Published: 25 Jul., 2016
Khalid M., ur Rahman H., Farhatullah, Rabbani A., Tahir M., Samad A., and Lightfoot D.A., 2016, Genetic variations in field condition clonally replicated sugarcane (Saccharum officinarum L.) cultivars on the basis of morphological and quality traits, Plant Gene and Trait, 7(5): 1-12 (doi: 10.5376/pgt.2016.07.0005)
This study is an initiative approach to assess the genetic variation on basis of enormous morphological and qualitative attributes for future breeding selection. A set of 16 sugarcane clones were evaluated in the fields of Sugar Crops Research Institute (SCRI), Mardan.- Pakistan during the spring cropping season of 2011-12. The clones were analyzed for 40 morphological (qualitative and quantitative) traits in a randomized complete block (RCB), design with four replications. Variations were measured for 16 morphological quantitative traits (1st germination, 2nd germination, 1st tillering, 2nd tillering, 1st plant height, 2nd plant height, leaf length, leaf width, leaf area, number of nodes per cane, internode length, weight of five unstrapped canes, weight of five strapped canes, yield, weight of trash and tops and number of millable canes), 20 morphological qualitative traits (cane height, cane color, hardiness, thickness, leaf colour, attitude, leaf shape, legule size, dewlap color, pith, bud shape, lodging, streaks, wax, tillering, pubescence, growth, maturity, tops and trash) and four qualitative laboratory traits (corrected brix percentage, pol percentage, purity percentage and recovery percentage). The data were analyzed using descriptive statistics (means, standard deviations, standard errors, variances and ranges) which showed considerable diversity among the studied sugarcane clones. The analysis of variance (ANOVA) exhibited highly significant difference (p<0.01) for 1st and 2nd germination, 1st and 2nd tillering, 1st and 2nd plant height, yield, number of millable canes, number of nodes per plant, internode length, weight of five unstripped canes, weight of five stripped canes. Moderately, significant differences (0.01< p <0.05) were recorded for leaf length, leaf area, as well as sugar purity and recovery. Cluster analyses were performed on the 40 different traits which divided the 16 sugarcane clones in to two main clusters (cluster I and cluster II) and two sub-clusters (IIA and IIB) which might reflect the genetic variations. Principal component analysis, reduced morphological variables to five independent linear combinations. The principal components of variables had Eigen values >1 and accounted for 84.04% of the total variance in the data. Analysis of the principal components inferred that 1st and 2nd tillering, 1st and 2nd plant height, weight of five unstripped canes, leaf area, millable canes, 1st and 2nd germination were the major parameters of variation. High degrees of variations were observed for most of the traits. Our analysis has described that the promising performance for all the traits and spatially for yield and sugar has shown by the genotype MS-99-HO-317 followed by the genotype MS-91-CP-238. It is concluded from this research that these two genotypes will be released for farmers community in the next year after approval from the VAC (Variety Approval Committee). Moreover, the breeders can use these genotypes in their future breeding program to achieve some better performing lines.
Introduction
Sugarcane (Saccharum officinarum L.) belongs to family Gramineae and is a complex hybrid of five different species of the genus Saccharum. There are two main groups within the genus; the thin, hardy types like the north Indian S. barberi (2n = 81 to 124) and the Chinese S. sinense (2n = 111 to 120) and the thick, juicy noble canes like S. officinarum (2n = 80). S. robustum (2n = 60 to 80) is the closest wild relative and putative ancestor of S. officinarum. It is believed that the origin of S. officinarum is the Indo-Myanmar -Chinese border. However, New Guinea is the main centre of diversity today. Flowering of S. officinarum is hard to predict and is rare in Pakistan therefore, most sugarcane varieties are maintained as vegetative clones. The maintenance of the purity, homogeneity and identity of clones is usually achieved by morphological marker analyses.
Morphological trait scores have been widely used as genetic markers in breeding and plant germplasm management. Although morphological markers are limited in number, their assays neither require sophisticated equipment nor complicated procedures (Singh and Singh, 1992). Unlike physiological, anatomical and molecular characterization, morphological characterizations are generally simple, rapid and inexpensive to score (Ghafoor, 1999). Until recently scientific classification of plants was based entirely on morphological traits (Stuessy, 1999). Morphological characterization of sugarcane cultivars, landraces and wild species is fundamental to breeders, researchers and growers for practical and scientific purposes and for the development of new varieties. Sugarcane characterization is often based on morphological traits and growth characters like growth habit (stool weights), tops weight, trashing amount, drought index, leaf blade and sheath shape, auricle, dewlap, ligule, internode, node and bud number. Morphological characteristics are used for the protection of new varieties of sugarcane and the associated intellectual property rights (UPOV, 1998). Growers undertake morphological characterization in order to maintain the purity and uniformity of their cultivated clonal varieties. Morphological characterization can also aid breeders and researchers in many ways including, identifying varieties, cultivars or related species, building phylogenetic relationships among related lines and developing selection criteria as parameters associated with desired traits of economic importance. The main traits desired are higher yields, pest and disease resistances. The identification of phenotypic traits for new genetic variants are especially important (Moore, 1987). Traditional tools for sugarcane breeders to identify different varieties depend on anatomical and these morphological characters (Skinner, 1972). At various international centers, the breeder used morphological descriptors such as stalk wax, leaf sheath wax, leaf sheath margin, leaf sheath hair (pubescence), dewlap appearance, stalk color, auricle size and color, and other distinguishing characteristics in the evaluation and selection of the best clones. However, breeders from other locations or researchers in other disciplines may not be familiar with scoring and evaluating these morphological traits. The problem of reproducibility is especially keen for traits for which differential expression has already been known to be strongly influenced by the environment (Pan, 2010).
Information about genetic variation based on morphological trait is a prerequisite for any breeding program. Shuffling and selecting new genetic diversity enables breeders to develop cultivars which can tolerate changing environments, new diseases, pests and climatic conditions. Studies of genetic divergence using different multivariate techniques such as cluster, canonical and principal component analyses have been used for the last two decades in several crops (Singh, 1981). The technique most often used is cluster analysis with group sampling units like varieties, lines and clones. The aim is, to obtain groups with a high degree of within- group homogeneity that consequently are heterogeneous in relation to one another (Johnson and Wichern, 1982; Viana et al., 1991).
The present study was conducted to evaluate 16 sugarcane genotypes for various morphological parameters in Pakistan using cluster, and principal component analysis.
1 Results and Discussions
Basic statistics for the quantitative traits are presented in Table 2 which showed maximum values of variance for 1st and 2nd germination, 1st and 2nd tilllering, 1st and 2nd plant height, leaf length, leaf area and millable cane. Therefore, there is scope for further improvement in these traits. For number of nodes, internode length, leaf width, weight of five unstrapped canes, weight of five strapped canes, weight of trash and tops, yield (tons per ha), C. brix, pol percentage, purity percentage and recovery also showed genetic variations, however, these were statistically non significant (p ≥ 0.05).
1.1 Morphological attributes analysis
1.1.1 Qualitative traits
The distinct groups formed morphological traits are presented in Table 1. Maximum variations were observed in plant height, cane color, hardiness, thickness, attitude, legule size, dewlap color, pith, bud shape, tillering, growth, maturity and tops. For these characters, selection for various genetic markers may be utilized by breeders in future breeding programs. However, for the other seven traits where low variability was observed, the clones with rare traits might be acquired by breeding program or to have more samples collected from the centers of genetic diversity.
.png) Table 1 Frequency distribution of qualitative traits of 16 sugarcane clones |
1.1.2 Quantitative traits
The estimation of range, mean, standard deviation, variance and standard error are shown in Table 2. High degree of variations was observed for most of the traits. A wide range of variations were observed for 1st and 2nd germination, 1st and 2nd tillering,1st and 2nd plant height, leaf length and leaf area.
.png) Table 2 Basic Statistics for different quantitative traits in 16 sugarcane clones |
1.2 Analysis of the variance (ANOVA)
The ANOVA results (Table 3 and Table4) showed highly significant differences (p≤0.01) for 1st germination and 2nd germination among the clones. Maximum buds germination (1st and 2nd germination) observed for genotype Mardan-93 i.e., 89 and 99, respectively where as minimum 1st germination and 2nd germination (41 and 48) was exhibited by genotype S-96-SP-1215. Number of tillers is playing a vital role in increasing the final yield of sugarcane. Highly significant differences (p≤0.01) were observed for 1st tillering and 2nd tillering. Maximum number of 1st tillering and 2nd tillering (250.75 and 378) were exhibited by the genotype MS-91-CP-238, whereas minimum numbers of 1st tillering and 2nd tillering (60.5 and 128.25) were recorded for genotypes S-96-SP-1215 and Hoth127, respectively. Differences in the performances of the clones reflect the genetic variations. 1st and 2nd plant height data showed highly significant differences (p<0.01), the highest 1st and 2nd plant height (172.4 cm and 252.5 cm) being exhibited by the genotype MS-99-HO-391 whereas the lowest (102.35 and 171.55) were recorded for the clone Mardan-93. All the genotypes displayed highly significant variations (p<0.01) for cane yield. Cane yield for all genotypes ranged between 62.39 and 121.19 tons per ha. Maximum cane yield (113.38 tons per ha) was recorded for the genotype MS-99-HO-317 whereas minimum yield (67.51 tons per ha) was obtained from the genotype Mardan-93. Highly significant differences (p<0.01) were exhibited by the clones for Millable cane which ranged between 80.5 and 129.25. Highest Millable canes (129.25) were exhibited by the genotype MS-99-HO-391 whereas lowest Millable canes (80.5) were shown by the genotype Mardan-93. Analysis of variance displayed highly significant differences (p<0.01) for number of nodes per plant. Maximum number of nodes per plant (29) were recorded for the genotype Hoth-127 whereas minimum (18) was displayed by the genotype MS-99-HO-675. This may due to diverse nature of clones used in the present studies. Highly significant differences (p<0.01) were observed among the genotypes for internode length. Highest internode length (20.8) was showed by the genotype MS-94-CP-15 whereas lowest internode length (13.6) was exhibited by the genotype Hoth-127. Highly significant differences (p<0.01) were exhibited by all genotypes for weight of five unstrapped canes. Highest weight of five unstrapped canes (10.8 kg) was shown by the genotype MS-99-HO-317 whereas lowest (6.0 kg) was displayed by the genotype MS-91-CP-272. Analysis of variance for weight of five strapped canes showed highly significant differences (p<0.01) among all the genotypes. Highest weight of five strapped canes (9.2 kg) was displayed by the genotype MS-99-HO-317 whereas lowest (5.0 kg) was represented by the genotype MS-91-CP-272. Significant differences (p<0.05) were observed among all the genotypes for leaf length. Highest leaf length (228.40 cm) was displayed by the genotype S-97CP-288 whereas lowest (114.53 cm) was shown by the genotype Hoth-127. Significant differences (p<0.05) among all the genotypes were observed for leaf area. The highest (1134.6 cm2) leaf area was displayed by the clone MS-99-HO-391 whereas the lowest (492.6 cm2) was exhibited by the clone MS-99-HO-93. The analysis of variance showed significant differences among all the genotypes for purity percentage. These results are in agreement with the finding of Tai and Miller, (2002). The highest range for this parameter recorded was 85%, exhibited by the clone MS-99-HO-93 whereas the lowest (79.8%) was shown by the clone MS-99-HO-388. Significant differences were recorded among all the clones for recovery as well. The highest recovery (11.3) was exhibited by the clone MS-99-HO-93 whereas the lowest (9.9) was observed for the clone MS-91-CP-238. Non-significant differences were observed among the traits i.e., weight of trash and tops, leaf width, pol percentage and C. Brix percentage.
 Table 3 Mean squares for 1st germination (F. Ger), 2nd germination (S. Ger), 1st tillering (F. T), 2nd tillering (S. T), 1st plant height (F. Pht), 2nd plant height (S. Pht), Yield (tons per ha), Milliable cane (MC), Nodes plnat-1 (NPP) for 16 Sugarcane clones Note: *Significant at 5% level of probability, ** Significant at 1% level of probability; Ns: Non significant, D.F: Degrees of freedom, C.V: Coefficient of variation |
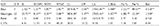 Table 4 Mean squares for Internode Length (IL), Weight of Five Unstrapped Canes (WFUSC), Weight of Five Strapped canes (WFSC) , Weight of Trash and Tops (WTAT), Leaf Length (LL), Leaf Width ( LW), Leaf Area (LA), Corrected Brix(C. Brix), Pol percentage, Purity percentage (Pur %) and Rec (Recovery) of 16 Sugarcane clones Note: *Significant at 5% level of probability, ** Significant at 1% level of probability; Ns: Non significant, D.F: Degrees of freedom, C.V: Coefficient of variation |
1.3 Cluster analysis
Cluster I consisted of three genotypes Hoth-127, S-97CP-288 and MS-99-HO-391 (Figure 1). Cluster II comprised 13 genotypes MS-91-CP-272, MS-94- CP-15, MS-91-CP-238, MS-92-CP-979, MS-99-HO-317, RS-97-N-45, MS-99-HO-388, MS-99-HO-675, MS-99-HO-93, S-96-SP-1215, CP-89-831, CP77/400 and Mardan-93. The cluster II is again divided in to two sub-clusters. Sub-cluster IIA comprised 7 clones MS-99-HO-675, RS-97-N-45, MS-99-HO-93, CP-89-831, S-96-SP-1215, CP77/400 and Mardan-93 clones whereas-sub cluster IIB consists of 6 clones MS-91-CP-272, MS-94- CP-15, MS-91-CP-238, MS-92-CP-979, -92-CP-979 and MS-99-HO-317. Mean values along with standard deviation of two clusters are presented in the Table 5. Cluster I consisted of genotypes which were similar in both quantitative and qualitative traits. Cluster II included genotypes showing intra-cluster diversity. Sub-cluster IIA included genotypes of sugarcane which varied from each other consistent with the diverse origin of these sugarcane clones. The genotype with lowest sugar recovery was present in sub-cluster IIB, whereas the highest recovery was found for the genotypes present in sub-cluster IIA. So genotypes in sub-cluster IIA can be used to develop cultivars with more sugar recovery. The highest yield (t ha-1) was found in sub-cluster IIB whereas the lowest was found sub-cluster IIA. The clones with higher tillering capability were found in the sub-cluster IIB whereas poor tillering features was observed in cluster IIA. Most genotypes with early maturity were in sub-cluster IIB, followed by sub-cluster II. Later maturing clones were mostly in cluster IIA. These results indicated the scope for selection from various clusters for the desired traits could be done which may be used for further crop improvement program.
.png) Figure 1 Cluster analysis of 16 sugarcane genotypes based on morphological (quantitative and qualitative) traits |
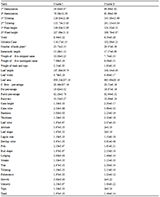 Table 5 Inter cluster variation for different quantitative and qualitative characters in sugarcane |
1.4 Principal Component Analysis
Only five of fifteen principal components had Eigen values greater than 1.0 (Table 6 and Table7). The primary four principal components had Eigen value of 5.74, 4.38, 2.98 and 2.00, and jointly accounted for 75.51% of the total variation among the genotypes. The first five principal components together explained over 85% of the total variation among the 20 quantitative traits. The first principal component (PC1) accounted for 28.72% of the total variance and had high contributing factor loadings from 1st plant height (0.822), leaf length(0.739), 2nd plant height(0.727), leaf area (0.718), weight of five unstripped canes (0.700), weight of five stripped canes (0.627), milliable cane (0.617), nodes plant-1 (0.515) and weight of trash and trash (0.509). The second principal component (PC2) accounted for 21.92 % variation and indicated the importance of 1st tillering (0.853), 2nd tillering (0.838), 2nd germination (0.609) and 1st germination (0.519). The traits associated with the third principal component (PC3) were nodes plant-1 (0.685), 2nd germination (0.667), 1st germination (0.519), yield (tons ha-1) (0.491) and milliable cane (0.481). PC 4, these accounted for 9.98 % of the total variance and showed positive loadings for 1st plant height (0.336) and leaf width (0.314). The principal component 5, which accounted for 8.56% of the total variability and described the traits leaf width (with a high loading of 0.706), followed by leaf area (0.574), 1st germination (0.478), internode length (0.411) and leaf length (0.319).(Figure 2-5)
 Table 6 Eigen values, % total and cumulative variance of the five most important characters from factor analysis |
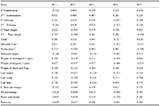 Table 7 Eigen vectors (loadings) of the first five principal components |
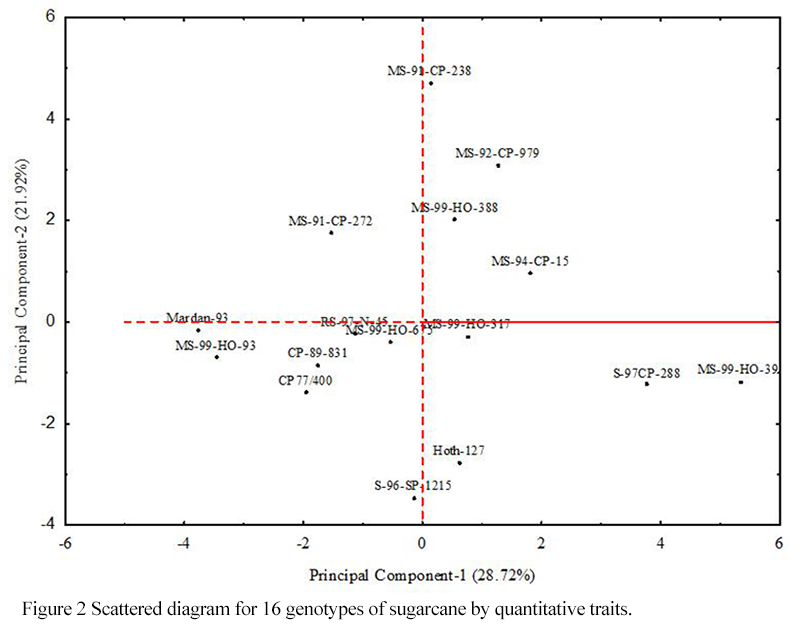 Figure 2 Scattered diagram for 16 genotypes of sugarcane by quantitative traits. |
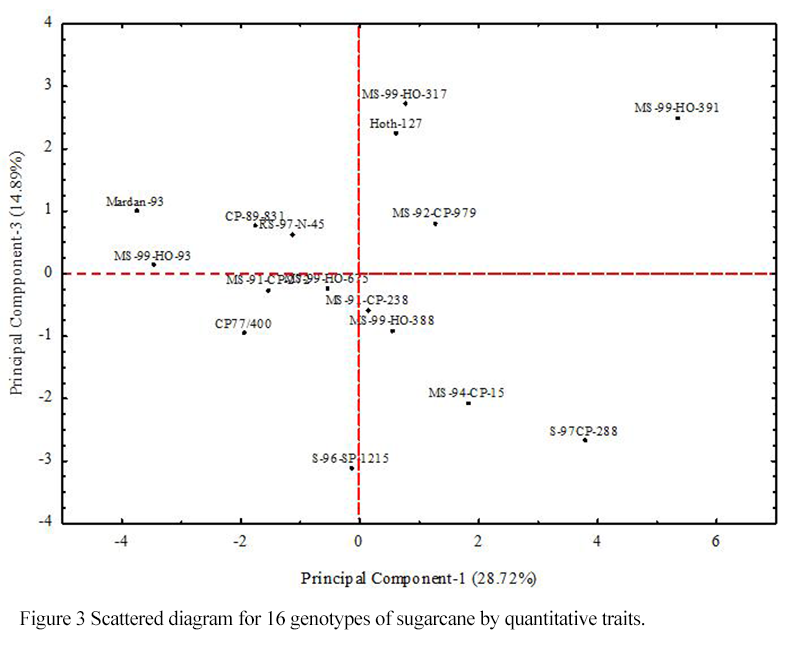 Figure 3 Scattered diagram for 16 genotypes of sugarcane by quantitative traits. |
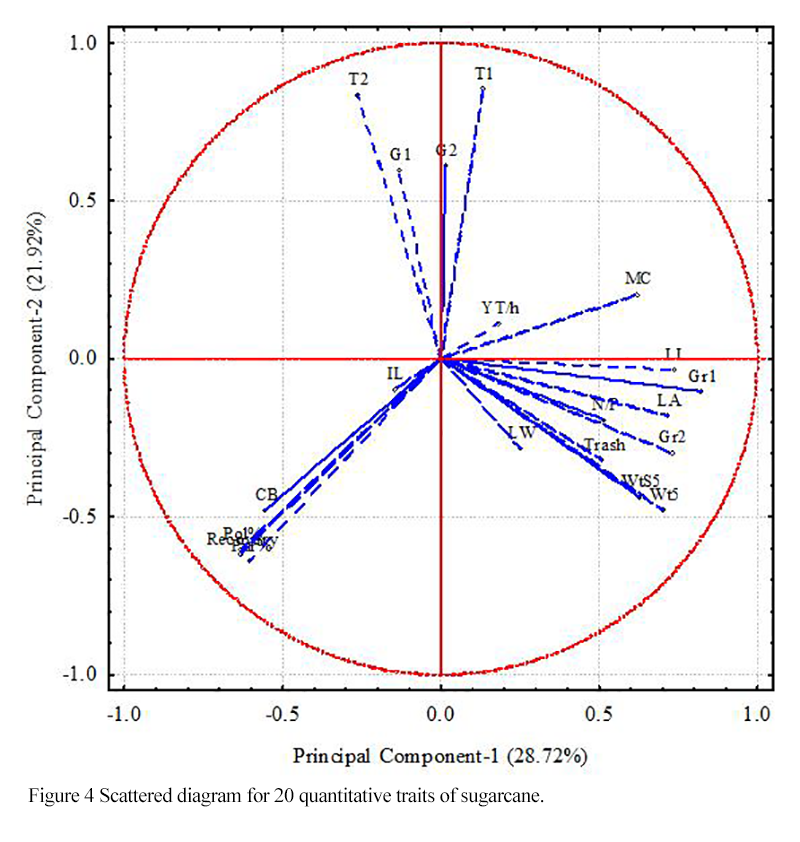 Figure 4 Scattered diagram for 20 quantitative traits of sugarcane. |
.png)
Figure 5 Scattered diagram for 20 quantitative traits of sugarcane. |
In our results we used different types of statistical tests. Each approach resulted in appreciable magnitude of genetic variations such as descriptive statistics for the quantitative traits showed maximum values of variations for 1st and 2nd germination, 1st and 2nd tilllering, 1st and 2nd plant height, leaf length, leaf area and millable cane. Therefore, the scope for further improvement in these traits can never be ignored. For number of nodes per cane, internode length, leaf width, weight of five unstrapped canes, weight of five strapped canes, weight of trash and tops, yield (tons per ha), C. brix, pol percentage, purity percentage and recovery also showed appreciable magnitudes of genetic variations.
Maximum variations were observed in plant height, cane color, hardiness, thickness, attitude, legule size, dewlap color, pith, bud shape, tillering, growth, maturity and tops. For these characters, selection for various genetic markers may be utilized by breeders in future breeding programs. However, for the other seven traits where low variability was observed, the clones with rare traits might be acquired by breeding program or to have more samples collected from the centers of genetic diversity. Morphological qualitative traits of sugarcane cultivars, landraces and wild species is fundamental to breeders, researchers and growers for practical and scientific purposes and for the development of new varieties. Sugarcane characterization is often based on morphological traits and growth characters like growth habit (stool weights), tops weight, trashing amount, drought index, leaf blade and sheath shape, auricle, dewlap, ligule, internode, node and bud number. Morphological characteristics are used for the protection of new varieties of sugarcane and the associated intellectual property rights (UPOV, 1998).
Highly significant variations were reported among the genotypes for germination, tillering, plant height, cane yield, millable canes, number of nodes per cane, internode length, weight of five unstrapped canes, leaf length, leaf area, weight of five strapped canes, weight of trash and tops while significant difference were recorded for parameter e.g., leaf length, leaf area, purity percentage and recovery. Previous research also revealed similar pattern of results. In the present finding for more precise results germination, tillering and plant height data were recorded twice. Tahir et al., 2014 also conducted such type of research. He conducted research on 25 sugarcane clones and observed considerable magnitude of genetic variations. Similarly Alam et al., (2011), recorded results in support of our research for germination, they reported significant differences among 10 crosses of sugarcane genotypes and observed variations in results for germination. The previous research work of Khan et al., (2007) revealed differences in tillering, plant height and leaf length, and leaf area which showed harmony to our results. Differences in cane yield among sugarcane clones was reported by Bahadar et al., (2002) which supported our findings. The highest millable canes were recorded for genotype MS-99-HO-391 whereas lowest Millable canes were shown by the genotype Mardan-93. Difference in millable canes were also detected by Anbanandan and Saravanan (2010). Similarities in performance in number of nodes per cane was displayed by the previous research work of Arain et al., (2011). This contradiction may be due to the high adoptability of the clones in the Thatta area which is considered more suitable for sugarcane cultivation and breeding. Kashif and Khan (2007) reported the results which are in agreement with our findings. In our experiment highest internode length (20.8) was shown by the genotype MS-94-CP-15 whereas lowest internode length (13.6) was exhibited by the genotype Hoth-127. Differences in performances of clones for weight of unstrapped five cane and weight of stripped five canes were recorded by the was observed by Suggo et al., (2010), who are in agreement to our findings for the same parameters. Tai and Miller (2002) and Bahadur et al., (2002) reported results which exhibited differences in performances of the clones for purity percentage and sugar recovery and supported our findings. Non-significant differences were observed among the traits i.e., weight of trash and tops, leaf width, pol percentage and C. Brix percentage. These results are in contrary with the findings of Guerra et al., (2009). These differences in results may be due to the multi-environmental trials which were conducted by the reported researchers. The cluster analysis classified the 16 sugarcane clones on the basis of 40 traits in to two main clusters (cluster I and cluster II) and two sub-clusters (IIA and IIB) which might reflect the genetic variations. Principal component analysis, reduced morphological variables to five independent linear combinations. The principal components of variables had Eigen values >1 and accounted for 84.04% of the total variance in the data. Analysis of the principal components inferred that 1st and 2nd tillering, 1st and 2nd plant height, weight of five unstripped canes, leaf area, millable canes, 1st and 2nd germination were the major parameters of variation. High degrees of variations were observed for most of the traits. Tahir et al., (2013) performed cluster analysis and PCA in 25 clone and observed 3 main cluster. Furthermore, they reported two main principle components i.e., vigor and quality which explained 93.34% and 7.36% of variations, respectively.
2 Conclusion
It is concluded that high degree of variations were observed for most of the traits in the present studies. Our analysis has described that the promising performance for all the traits and spatially for yield and sugar yield has shown by the genotype MS-99-HO-317 followed by the genotype MS-91-CP-238. It is suggested that these two genotypes will be released for farmers community in the next year after approval from the VAC (Variety Approval Committee). Moreover, the breeders can use these genotypes in their future breeding program to achieve some better performing lines. The rest of clones should be utilized in future breeding programs to draw some conclusive results.
3 Materials and Methods
3.1 Plant material and statistical analysis
To assess the genetic variations among sugarcane clones, a set of 16 genotypes were sown at the fields of Sugar Crops Research Institute (SCRI), Mardan- Pakistan during the spring cropping season of 2011-12. The experiment was laid out in a randomized complete block (RCB), design with four replications. The plot size was 67 m2 with 10 m row length and 6.7 m row width and plant to plant distance was kept 90 cm. Three budded double sets were used as sowing materials. The list of sugarcane clones and their origin is given in Table 8. The Recommended dose of fertilizer was used (N,- P, and K at 150,-100, and -100 Kg per ha from Urea, DAP and SOP). It was applied as 4.5 bags (50 kg) DAP per ha at planting time and 5 bags (50 kg) SOP plus 2.5 bags (50 kg) urea per ha in March-April. In addition urea was applied as 2.5 bags urea/ha at earthing up. Pesticides and other inputs were applied at specific times necessary to raise a good crop that season. Forty traits were brought under the current studies in which 20 were morphological qualitative, four were quantitative measures of cane juice quality and 16 were morphological quantitative traits. Data were recorded on five plants randomly selected within each plot. All the morphological qualitative data were recorded at maturity. The cane juice quality parameters were evaluated at Sugar Crops Analytical Laboratory (Mardan, Pakistan) from the fresh cane samples after harvesting the crop. The list of qualitative attributes and further types of each trait are given in Table 9. The quantitative attributes in plants were recorded as the mean of five plants and the data were taken from the central row only. The list of quantitative attributes is given in Table 10.
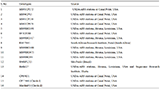 Table 8 List of 16 sugarcane genotypes and their source used for morphological characterization at SCRI, Mardan, during 2011-12 |
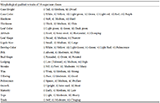 Table 9 New ICT based fertility management model in private dairy farm India as well as abroad |
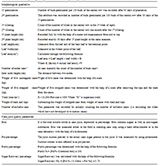 Table 10 New ICT based fertility management model in private dairy farm India as well as abroad |
3.2 Statistical analysis
The averaged data were analyzed for simple statistics including mean, standard deviation, variance, range, standard error and frequency distribution, using computer software MS EXCEL, Windows 7. ANOVA was performed by using computer software MSTATC package version 1.2 (Freed, 1990). Morphological, qualitative and quantitative data were subjected to dendrogram analysis to determine the genetic divergence among the genotypes by complete linkage cluster analysis using the SAHN (Sequential, Agglomerative, Hierarchical, And Nested) option of NTSYS-pc 2.2 version (Rohlf, 2005). Principal Component Analysis was carried out with the help of computer software “Statistica version-7”. Different attributes were measured by different units, so the average values of the parameter were standardized before the PC analysis to eliminate differences in values.
Authors’ contributions
Muhammad Khalid designed this research idea, carried out the analysis of data using different computer softwares and drafted this scientific article. All authors Hidayt ur Rahman, Farhatullah, Amamullah participated in the reviewing of this article. Ashiq Rabbani has done a tremendous job in the analysis of data and the last but not the least Dr. David A. Lightfoot has polished and finalized this article. His valuable suggestions made this article to be published in Plant Gene & Trait.
Acknowledgements
This research was funded by the Higher Education Commission (HEC) of Pakistan and Sugar Crops Research Institute, Mardan, Pakistan. All the authors are very thankful of the staff of the Sugar Crops Research Institute (SCRI), Mardan-Paksitan from official to sub-ordinate for their co-operation and valuable advices regarding rising of the sugarcane crop. Special thanks are extended to Mr. Mohammad Tahir and Mr. Islam Zada working as Research Officers at Sugar Crops Research Institute (SCRI), Mardan-Paksitan who helped a lot in data collection of different parameters of sugarcane.
Alam A., Deb A.C., Mannan M.A., and Khaleque M.A., 2011, Inheritance study of seven quantitative characters using North Carolina Design in sugarcane, Pak Sugar J, 26(4): 12-20
Anbanandan V., and Saravanan K., 2010, Genetic variability in interspecific and intergeneric progenies in sugarcane, 10: 627-632
Arain M.Y., Panhwar R.N., Gujar N., Chohan M., Rajput M.A., Soomro A. F., and Junejo S., 2011
Bahadar K., Jamal M., Sadiq M., Suleman M., Azim H., and Baluch M.S., 2002, Genetic variation and ecological suitability of new Sugarcane under the agro-climatic conditions of Bannu (KPK), Pak Sugar J, 27(4): 15-17
Freed R.D., 1990, MSTATC Ver 1.2, Michigan State Univ., Michigan, USA
Ghafoor A., Qureshi A.S., and Zahoor M., 1999, Crossing techniques in black gram (Vigna mungo), Pak J Arid Agric, 2(1): 25-31
Guerral E.P., de Oliveira R.A., Daros E., Zambon J.L.C., Ido O.T., and Filho J.C., 2009,Crop Breed and Appl Biotech,9(3): 260-267
http://dx.doi.org/10.12702/1984-7033.v09n03a08
Johnson R.A., and Wichern D.W., 1982, Applied multivariate statistical; analysis, Prentice-Hall, New Jersey, USAKashif M., and Khan F.A., 2007, Divergence in sugarcane (Saccharum officinarum L.) based on yield and quality traits, Pak. J. Bot., 39(5): 1559-1563
Khan F.A., Iqbal M.Y., and Sultan M., 2007, Morphogenetic behavior of some agronomic traits of Sugarcane (Saccharum officinarum L.), Pak. J. Agri. Sci., 44(4): 600-603
Moore P.H., 1987, Anatomy and morphology of sugarcane. Elsevier Sci. Publishing Co., New York., pp. 85-142 PMCid: PMC1033255
Pan Y.B., 2010, Data basing Molecular Identities of Sugarcane (Saccharum spp.) Clones
Constructed with Microsatellite (SSR) DNA Markers, American J. Plant Sci., 85(1): 87-94
Rohlf F.J., 2005, NTSYS-pc Numerical Taxonomy and Multivariate Analysis System, version 2.2., Exeter Publications, Applied Biostatistics Inc., New York
Sing D., (1981), The relative importance of characters affecting genetic divergence. Ind J Gen Plant Breed., 41: 237-245
Singh, D.P., and B.B. Singh. 1992. Inheritance of morphological characters in chickpea (Cicer arietinum L.). Indian. J. Genet. 52 (1): 55-57
Stuessy T., 1990, Plant Taxonomy, Columbia Univ. Press, New York
Suggu A.G., Ahmed E., Himayatullah H., Ayaz M., Ahmed H.K., and Aslam M.
Tahir M., Rahman H., Gul R., Ali A., Khalid M., 2013, Genetic divergence in sugarcane genotypes, Ameri. J. experi. Agri., 3(1): 102-109
Tai P. Y.P., and Miller J.D., 2002,Crop Sci., 42: 958–964
http://dx.doi.org/10.2135/cropsci2002.0958
UPOV.,1998, Draft test guidelines for sugarcane, Unio Internationale Pour La Protection Des Obtentions Vegeable (UPOV), Geneva, Switzerland, pp.3-30
Viana J.M.S., Cardoso A.A., Cruz C.D., Regazzi A.J., and del Giudice R.M., 1991, Genetic divergence in sugarcane (Saccharum spp.) clones, Brazil. J. Genet., 14(3): 753-763


. PDF(458KB)
. HTML
Associated material
. Readers' comments
Other articles by authors
. Muhammad Khalid
. Hidayat ur Rahman
. Farhatullah Farhatullah
. Ashiq Rabbani
. Mohammad Tahir
. Abdus Samad
. David A. Lightfoot
Related articles
. Genetic variations
. Morphological
. Sugarcane
. Quantitative and qualitative traits
Tools
. Email to a friend
. Post a comment