Analysis of QTL for Three Leaf Traits in Phalaenopsis based on AFLP Molecular Genetic Map 
2. College of Landscape and Art, Jiangxi Agriculture University, Nanchang, 330045, P.R. China
3. College of Horticulture, South China Agricultural University, Guangzhou, 510640, P.R. China
 Author
  Correspondence author
Plant Gene and Trait, 2012, Vol. 3, No. 7 doi: 10.5376/pgt.2012.02.0007
Received: 09 Mar., 2012 Accepted: 20 Jun., 2012 Published: 27 Jun., 2012
Xu et al., 2012, Analysis of QTL for Three Leaf Traits in Phalaenopsis based on AFLP Molecular Genetic Map, Plant Gene and Trait, Vol.3, No.7 34-42 (doi: 10.5376/pgt. 2012.03.0007)
In this research, we employed a hybrid population between ‘Phal.462’ and ‘Phal.20’as the tested materials to evaluate the leaf length (LL), leaf width (LW), plant width (PW) of 88 individual Phalaenopsis progenies. These 3 traits of the progenies showed continuous normal distribution statistically in the population, and a significant correlation was found between LL and PW. The quantitative trait locus (QTL) controlling those traits were analyzed by using interval mapping method based on the AFLP marker linkage maps. The results showed that a total of 60 QTLs covered eight linkage groups were detected in the paternal parent genetic map, 20 of which was for LL, 19 for LW and 21 for PW. Phenotypic variation explained by each QTL ranged from 44.1% to 89.4% with the LOD value from 3.05 to 14.78. While a total of 28 QTLs were detected on five linkage groups of the maternal parent genetic map, 10 of which was for LL, 8 for LW and 10 for PW. Phenotypic variation explained by each QTL ranged from 57.7% to 76.3%, with the LOD value from 3.11 to 9.24. This may be the first QTL analysis in Phalaenopsis in the world as the authors knew, which could provide a new tool for cloning of genes and molecular marker-assisted breeding for Phalaenopsis with complicate genome in the future.
Through phenotypic trait observation and molecular markers correlation analysis, Quantitative trait locus (QTL) was involved in specifying quantitative traits can be mapped the positions on chromosome or linkage groups and be identified the function and interactions, which will provide a basis for identification and clone of the genes underlying trait variations. Weller (1986) was the first person to use QTL mapping. Though this method could not make sure to get the maximum likelihood estimate, it’s a landmark of maximum likelihood in QTL mapping. Subsequently, Lander and Botstein (1989) developed the interval mapping method of QTLs (interval mapping, IM), whilst, got the largest QTL information of these two markers on a chromosome segment by taking advantage of the separation information of molecular markers flanking each other on the linkage map. Map Marker / QTL software can quickly estimate the QTL location and the contribution to the phenotype by using the high density molecular linkage map (Lincoln, 1993). From then on, many mapping methods came out, which plays an important role in QTL mapping researches. They have been applied to identify and sequenced the various actual genes in Arabidopsis (Jonathan et al., 2005), rice (Wang et al., 1994), tomato (Truco et al., 2000) and other plants.
Phalaenopsis, known as the Queen of orchids, is one of the most popular tropical orchid genuses in the world due to their attractive inflorescence, and long-lasting flowers. With fast development of Phalaenopsis industry in recent decades, It is reported that the researches involved in genetic engineering breeding (Liao et al., 2004), molecular marker-assisted selection breeding (Zhang et al., 2007), species identification (Zhang, 2004), genetic diversity studies (Been et al., 2002). However, the molecular biology and genetics of Phalaenopsis are still being poorly understood (Xu et al., 2010), The genetic map and QTL analysis of Phalaenopsis have not been reported yet. We constructed the molecular genetic maps of AFLP from a hybrid population (Xu, 2010). In Phalaenopsis, leaves conferring the shape and size of plant are the most important organ of vegetative and nutrient storage for lacking an obvious stem. In this study three phenotypic traits of the leaves, the leaf length (LL), leaf width (LW)ã€plant width (PW) of Phalaenopsis were calculated and used to establish a QTLs mapping and to locate on the genetic linkages of ALFP. We tried to explore a new way for the genetic analysis of relevant functional genes, gene cloning and marker-assisted breeding for genome complex species.
1 Result and Analysis
1.1 The distribution of phenotypic values of Phalaenopsis LL, LW and PW
Statistical analysis indicated that the phenotypic values showed a clear separation, and had a significant reduction in variability (Table 1). The frequency distribution further showed that they were normal distribution (Figure 1), the distribution of the peak and skewness were less than 2. Therefore, all these statistical parameters showed that these three traits have typical features of quantitative inheritance controlled by equivalent polygenes.
Table 1 Segregation of LL, LW, and PW traits of Phalaenopsis progenies in the hybrid population |
Figure 1 Segregation of LL, LW, and PW traits of Phalaenopsis progenies in the hybrid population |
1.2 Correlation analysis between the three phenotypic traits
Table 2 Correlation analysis among LL, LW, and PW traits of Phalaenopsis progenies |
1.3 QTL analysis for LL, LW and PW in AFLP linkage group of the paternal parent Phalaenopsis
.png) Table 3 Results of QTLs controlling LL, LW, and PW on AFLP linkage of paternal parent Phalaenopsis |
|
Figure 2 QTLs controlling LL, LW, and PW trait in AFLP linkage groups of paternal parent Phalaenopsis |
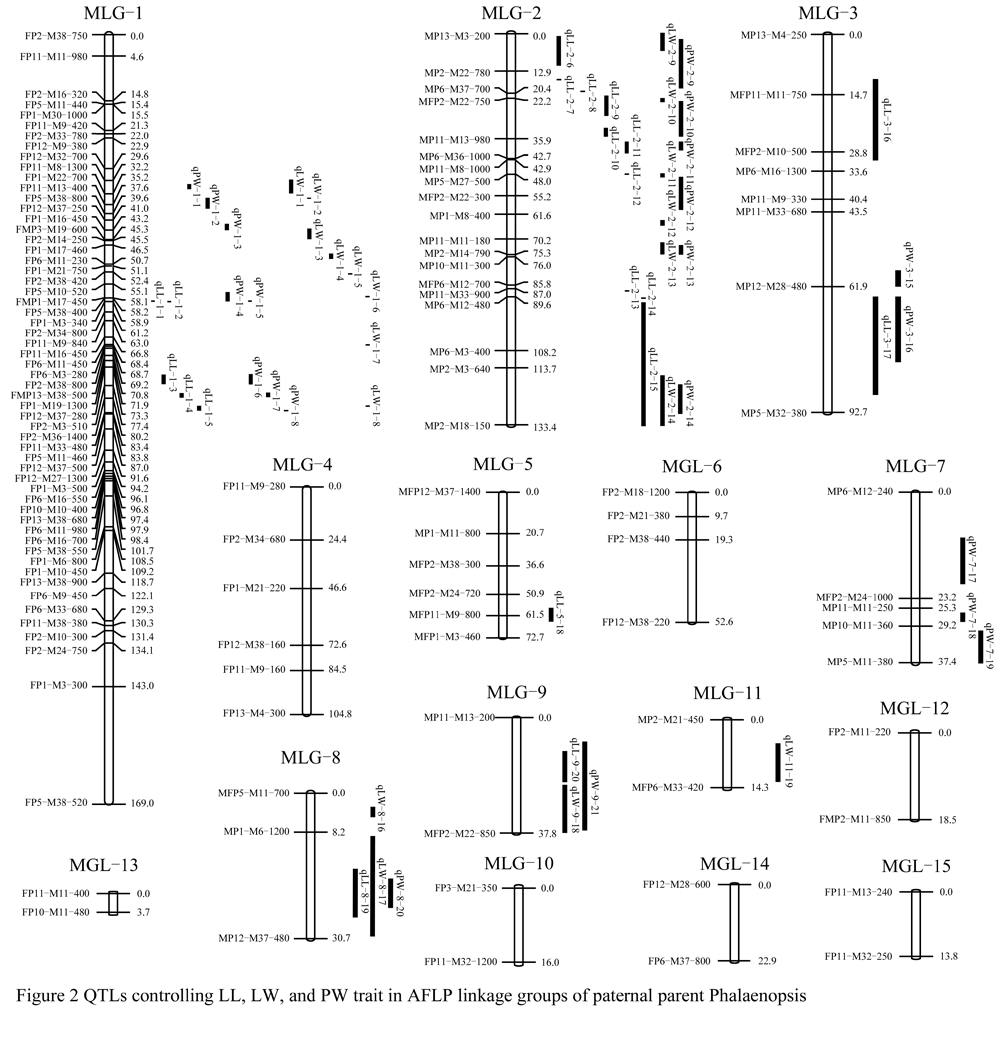
Twenty QTLs for the LL trait were detected in six linkage groups, they were MLG-1, MLG-2, MLG-3, MLG-5, MLG-8 and MLG-9, respectively. The LOD value in these DTLs was between 3.05 and 11.08. The total phenotypic variation was represented 1 366.1% of these 20 QTLs, with 44.1% to 89.4% of the single phenotypic variation.
For the LW trait, 19 QTLs were found in five linkage groups, which was MLG-1, MLG-2, MLG-8, MLG-9 and MLG-11, respectively. The LOD value was between 3.11 and 14.78. The total phenotypic variation was represented 1 230.4% of these 19 QTLs with 54.2%~89% of the single phenotypic variation.
QTLs for the PW trait, six linkage groups were distributed, which was MLG-1, MLG-2, MLG-3, MLG-7, MLG-8 and MLG-9, respectively. The single phenotypic variation presented that each QTL had larger difference, the minimal variation in the qPW-2-9 was55.3%, and the maximal in qPW-2-11 was 88.7%. Therefore, the total phenotypic variation was 1317.8% in total 21 QTLs.
1.4 QTL analysis of the AFLP linkage group in the maternal parent Phalaenopsi
Total twenty-eight QTLs conferring the three horticultural traits LL, LW, PW were detected, and they distributed in five linkage groups (Table 4; Figure 3).
|
Table 4 Results of QTLs controlling LL, LW, and PW on AFLP linkage of maternal parent Phalaenopsis |
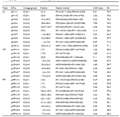
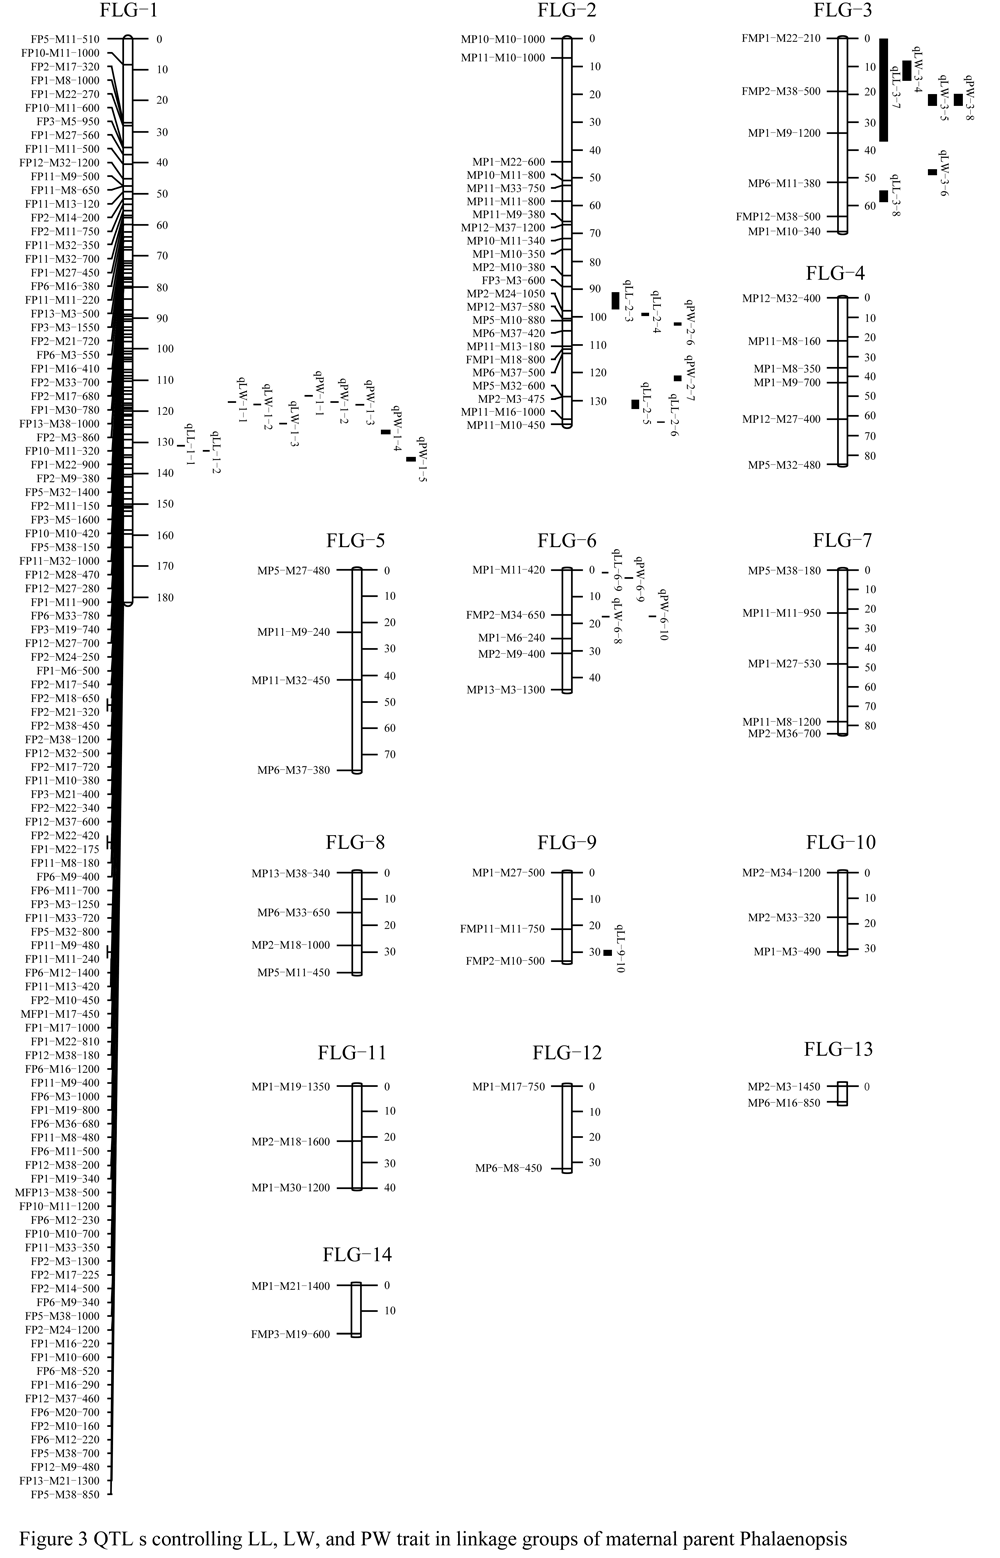 Figure 3 QTL s controlling LL, LW, and PW trait in linkage groups of maternal parent Phalaenopsis |
Ten QTLs for the LL trait were detected in five linkage groups, they were FLG-1, FLG-2, FLG-3, FLG-6 and FLG-9, respectively. The LOD value was between 3.11 and 14.78. The phenotypic variation was represented larger difference in each QTL had, the minimal variation in the qLL-3-8 was 57.7%, and the maximal in qLL-2-4 was 76.3% The total phenotypic variation was explained 1 317.8% in 10 QTLs.
For the LW trait, eight QTLs were found in three linkage groups, which was FLG-1, FLG-3 and FLG-6, respectively. The LOD value was between 3.11 and 7.63.The total phenotypic variation was represented 506.8% in these 8 QTLs with 57.8%~69.3% of the single phenotypic variation.
Ten QTLs for the PW trait were distributed among four linkage groups, which was FLG-1, FLG-2, FLG-3 and FLG-6, respectively. The LOD value was between 3.76 and 6.29. The total phenotypic variation was 614.5% of these 10 QTLs, with 56.3%~68.5% of the single phenotypic variation.
2 Discussions
QTL analysis results showed that the expression of the traits in Phalaenopsis leaves and plant types were regulated by polygenic loci located in different linkage groups. Studies have shown that QTLs with closed traits were often mapped on the same or adjacent areas. It is common that the genes that have the closed functions cluster together, (Xiao et al., 1996; Li et al., 2003; Jiang et al., 2004) and may also be a universal phenomenon of gene expression and regulation in nature. There is significant correlation between LL and PW, QTLs of the two traits have overlapped in the linkage groups of MLG-1, MLG-2, MLG-3, MLG-8, MLG-9, FLG-3 and FLG-6, which showed the genes or loci controlling the relevant traits tended to aggregate on the same linkage group or on an adjacent region of linkage groups. The phenomenon may demonstrate the regulation with pleiotropy effect or multigenic effect.
There are more genes controlling leaf traits in the paternal parent linkage groups than that in the maternal parent linkage groups by this QTL analysis. A total of 60 QTLs were detected in the paternaparent genetic map, while 28 QTLs were detected in the maternal parent genetic map. There are a clear separation and a significant reduction in variability in the phenotypic values of LL, LW, PW hybrid population. However, whether it was also easy to affect by paternal parent or showed more paternal parent leaves traits, this need noteworthy and deep analysis. QTL mapping is based on the phenotypic values of quantitative traits which can be the interaction results of genotype and environment, so there were probably errors in QTL analysis when using phenotypic values, i.e., the effect of QTLs could be significantly influenced by environment (Tinker et al., 1996). For instance, 29 QTL were detected in tomato that grew up in the three environments, but only four QTLs have significant expression in the three environments (Paterson et al., 1991). However, some studies suggested the environment had little effect on major QTL and was stable in different environments (Tanksley et al., 1982; Hayes et al., 1993). Therefore, the collection of phenotypic value for QTL mapping should exclude the error caused by the environment as much as possible so that those values could truly show the characteristics and differences of the traits. On the other hand, major QTL should be selected as possible as the genes or sequences conferring the traits would be tracked and cloned.
It is very difficult to develop the genetic linkage maps and do QTL analysis for Phalaenopsis due to its complicate genetic background of the heterozygosis and numerous chromosomes. QTL analysis for Phalaenopsis based on molecular linkage groups would possibly be another useful and convenient way for finding out the gene sequences associated with quantitative traits. With the construction of higher density molecular genetic maps using different molecular markers, more quantitative traits loci will be located and the accuracy of positioning will be improved, which would be helpful for cloning of genes and molecular marker-assisted breeding for Phalaenopsis in the future.
3 Materials and Methods
3.1 Plant materials
The materials for AFLP and QTLs analysis from a hybrid population Phal.20 x Phal.462 are developed by Guangdong Academy of Agricultural Sciences. Phal.462 has creamy white flowers overlaid with big waxy magenta spots, big leaf, and non-flavor; Phal.20 has creamy yellow flowers with small mahogany spots, middle leaf, and weak flavor. 88 progenies were randomly selected from 450 hybrid population for QTL analysis.
3.2 Collection of leaf traits and AFLP molecular linkage mapping
According to UPOV (2003) new varieties of Phalaenopsis DUS testing guidelines, the leaf length (leaf length, LL) and leaf width (leaf width, LW) were measured. At the flowering stage, choose the longest leaf. Plant size was represented using plant width (plant width, PW), which was the maximum length between two leaves. The molecular genetic maps of Phalaenopsis were constructed according to CP models using Joinmap3.0 software (Xu, 2010).
3.3 Data statistic and QTL analysis
Data of the traits were analyzed using SPSS13.0. The phenotypic effect of individual QTLs was estimated by MapQTL5.0 (Van et al., 2004). The genetic linkage map was described by interval mapping (IM) (Lander and Botstein, 1989). This stringent threshold, similar to an LOD score of 3.0, is used to achieve an experiment-wise false positive rate no higher than 0.05. The percentage of phenotypic variance explained by each QTL and the percentage of phenotypic variance explained by the QTLs given all the covariants were also estimated by Win QTL Cartographer. QTL nomenclature follows a method used in rice (McCouch et al., 1997), starting with ‘q’, followed by an abbreviation of the trait name [leaf length (LL), leaf width (LW), plant width (PW)] and the name of chromosome, then followed by a number.
Authors' Contributions
SPX, XRL, and JML executed this study; SPX completed the data analysis and wrote the first draft; XRL, and JML involved in experimental design and analysis of the results; GPW directed the molecular marker technology and data processing; FQL was the instructor who involved in guiding the study and essay writing and modify. FXL was the planner and responsible person of this study, who developed the hybrid population, directed the experimental design, data analysis and thesis writing. All authors have read and approved the final manuscript.
Acknowledgements
This paper was funded by the Programs (2008A020100019) and (2005B20901001) of Guangdong provincial Science and Technology Department. Much thanks to Mr.Zhang Mongjin and Ms Cai Shaohui who helped to develop the hybrid population.
References
Been C.G., Na A.S., Kim J.B., Kim H.Y., 2002, Random amplified polymorphic DNA (RAPD) for genetic analysis of Phalaenopsis species, Journal of the Korean Society for Horticultural Science, 43(4): 387-391
Jiang G.H., Xu C.G., Li X.H., He Y.Q., 2004, Characterization of the genetic basic for yield and its component traits of revealed by doubled haploid population, Acta Geneitca Sinica, 31(1): 63-72
Jonathan D.W., Justin O.B., Norman W., Gabriel T.T., Joseph R.E., Joanne C., and Detlef W., 2005, Quantitative trait locus mapping and DNA array hybridization identify an FLM deletion as a cause for natural flowering-time variation, Proceedings of the National Academy of Sciences., 102(7): 2460-2465
http://dx.doi.org/10.1073/pnas.0409474102 PMid:15695584 PMCid:548991
Hayes P.M., Liu B.H., Knapp S.J., Chen F., Jones B., Blake T., Franckowiak J., Rasmusson D., Sorrells M., Ullrich S.E., Wesenberg D., and Kleinhofs A., 1993, Quantitative trait locus effects and environment interaction in a sample of North American barley germplasm, Theor. Appl. Genet., 87(3): 392-401
http://dx.doi.org/10.1007/BF01184929
International Union for the Protection of New Varieties of Plants (UPOV), April 9, 2003, Guidelines for the conduct of Tests for Distinctnedd, Uniformity and Stability, Phalaenopsis
Lander E.S., and Botstein D., 1989, Mapping mendelian factors underlying quantitative traits using RFLP linkage maps, Genetics, 121(1): 185-199
PMid:2563713 PMCid:1203601
Li Z.F., Wan J.M., Xia J.F., and Zhai H.Q., 2003, Mapping quantitative trait loci underlying appearance quality of rice grains (Oryza sativa L.), Acta Genetica Sinica, 30(3): 251-259
PMid:12812091
Lincoln S., 1993, Mapping genes controlling quantitative traits using MAPMAKER/QTL version 1.1, Whitehead Institute Technical Report, Cambridge, Massachusetts
Liao L.J., Pan I.C., Chan Y.L., H Y.H., Chen W.H., and Chan M.T., 2004, Transgene silencing in Phalaenopsis expressing the coat protein of cymbidium mosaic virus is a manifestation of RNA-mediated resistance, Molecular Breeding, 13(3): 229-242
http://dx.doi.org/10.1023/B:MOLB.0000022527.68551.30
McCouch S.R., Cho Y.G., Yano M., Paul E., Blinstrub M., Morishima H., and Kinoshita T., 1997, Report on QTL nomenclature, Rice Genetics Newsletter, 14: 11-13
Paterson A.H., Damon S., Hewitt J.D., Zamir D., Rabinowitch H.D., Lincoln S.E., Lander E.S., and Tanksley S.D., 1991, Mendelian factors underlying quantitative trait in tomato: Comparison across species, generations and environments, Genetics, 127(1): 181-197
PMid:1673106 PMCid:1204303
Tanksley S.D., MedinaFilho H.P., and Rick C.M., 1982, Use of naturally-occurring enzyme variation to detect and map genes controlling quantitative traits in an interspecific backcross of tomato, Heredity, 49: 11-25 http://dx.doi.org/10.1038/hdy.1982.61
Tinker N.A., Mather D.E., Rossnagel B.G., Kasha K.J., Kleinhofs A., Hayes P.M., Falk D.E., Ferguson T., Shugar L.P., Legge W.G., Irvine R.B., Choo T.M., Briggs K.G., Uiirich S.E., Franckowiak J.D., Blake T.K., Graf R.J., Dofing S.M., Maroof M.A.S., Scoles G.J., Hoffman D., Dahleen L.S., Kilian A., Chen F.Q., Biyashev R.M., and Kudrna D.A., Steffenson B.J., 1996, Regions of the genome that affect agronomic performance in two-row barly, Crop Science, 36(4): 1053-1062
http://dx.doi.org/10.2135/cropsci1996.0011183X003600040040x
Truco M.J., Randall L.B., Bloom A.J., and Clair D.A., 2000, Detection of QTLs associated with shoot wilting and root ammonium uptake under chilling temperatures in an interspecific backcross population from Lycopersion esculentum×L. hirsutum, Theoretical and Applied Genetics, 101(7): 1082-1092
http://dx.doi.org/10.1007/s001220051583
Van Ooijen J.W., and Kyazma B.V., 2004, MapQTL®5, software for the mapping of quantitative trait loci in experimental populations, Wageningen, The Netherland
Wang G.L., Mackill D.J., Bonman J.M., McCouch S.R., Champoux M.C., and Nelson R.J., 1994, RFLP mapping of genes conferring complete a durably resistant rice cultivar, Genetics, 136(4): 1421-1434
PMid:7912216 PMCid:1205921
Weller J.I., 1986, Maximum likelihood techniques for the mapping and analysis of quantitative trait loci with the aid of genetic markers, Biometrics, 42(3): 627-640
http://dx.doi.org/10.2307/2531212 PMid:3567295
Xiao J., Li J., Yuan L., and Tanksley S.D., 1996, Identification of QTLs affecting traits of agronomic importance in a recombinant inbred population derived from a subspecific rice cross, Theor. Appl. Genet., 92: 230-244 http://dx.doi.org/10.1007/BF00223380
Xu S.P., Zhang T.F., Liao F.X., and Lian F.Q., 2010, A review on studies of phalaenopsis germplasm resources and breeding, Chinese Horticulture Abstracts, 5: 27-30
Xu S.P., 2010, Construction of molecular genetic map and analysis of qtls for some traits in Phalaenopsis, Thesis for M.S., The College of Landscape and Art, Jiangxi Agricultural University, Supervisor: Liao Feixiong
Zhang N., Su M.H., Xu S.X., and Lin Q.H., 2007, Radioactive breeding of Phalaenopsis spp. using RAPD method, Subtropical Plant Science, 36(3): 19-22
Zhang S.T., 2004, Identify Phal.amabilis and Phal.aphrodhe by RAPD and ISSR molecular markers, Proceedings of the Exhibition on New Technology of Floriculture in 2004 Zhanghua Flower Expo, 163-166


. PDF(1127KB)
. FPDF(win)
. HTML
. Online fPDF
Associated material
. Readers' comments
Other articles by authors
. Shenping Xu
. Xiaorong Liu
. Jingmei Liu
. Guoping Wang
. Fangqing Lian
. Feixiong Liao
Related articles
. Orchid
. Genetic
. Quantitative trait
. Gene locus
. Molecular mapping
Tools
. Email to a friend
. Post a comment