Research Report
Genetic Variation in the FT1 Locus Involved in Reproductive Onset in Populus deltoides 
2 Department of Sustainable Bioproducts, College of Forest Resources, Mississippi State University, Starkville, MS, USA
3 Department of Forestry, Mississippi State University, Starkville, MS, USA
4 Department of Plant and Soil Sciences, Mississippi State University, Starkville, MS, USA
 Author
  Correspondence author
Tree Genetics and Molecular Breeding, 2016, Vol. 6, No. 1 doi: 10.5376/tgmb.2016.06.0001
Received: 21 Mar., 2016 Accepted: 21 Apr., 2016 Published: 30 Jun., 2016
Ali Akgul, Ayfer Akgul, Scott D. Roberts, Richard L. Harkess, Susan V. Diehl, 2016, Genetic Variation in the FT1 Locus Involved in Reproductive Onset in Populus deltoides, Tree Genetics and Molecular Breeding, 6(1): 1-10 (doi: 10.5376/tgmb.2016.06.0001)
The onset of reproduction is an important event in tree development and adaptation. Reproductive onset is controlled by the FT1 locus in poplar (Populus sp.). However, sequence variation in this locus is not well understood. To enable large-scale polymorphism studies, the aim of this research was to identify sequence variation in the FT1 locus in a small population of Populus deltoides with varying reproductive onset. Gene specific primers were designed to amplify four exons and three introns of FT1, from 14 genotypes. The sequence analysis showed 9 single nucleotide polymorphisms and 4 insertion-deletion sites located in introns of FT1. Transcript expression analysis in two groups with different reproductive onset phenotypes showed FT1 transcript expressed higher in the early flowering genotypes than late flowering genotype. This information expands the understanding of the genetic basis of phenotypic variation in reproductive onset in Populus deltoides.
1 Introduction
The FLOWERING LOCUS T (FT)-like family genes are responsible for the regulation of photoperiodic flowering in plants. FT encodes a floral activator and this integrates signal inputs from various pathways regulating flowering time(Pin and Nilsson, 2012; Wigge, 2011). Recent studies have shown the protein encoded by FT gene is part of florigen. FT was initially discovered to induce reproductive onset in long day plant, Arabidopsis thaliana. (Kardailsky et al., 1999; Kobayashi et al., 1999) When a light signal was perceived by leaves of the long-day plant Arabidopsis and the short day plant rice (Oryza sativa), the CONSTANS (CO) protein activated FT in the leaf phloem(An et al., 2004; Ayre and Turgeon, 2004). Subsequently, the FT protein appeared to be translocated to the shoot apex where it formed a protein complex with the FLOWERING LOCUS D (FD) protein. This complex activated the floral meristem identity gene APETALA1 (AP1) to trigger reproductive development(Abe et al., 2005; Corbesier et al., 2007; Mathieu et al., 2007; Tamaki et al., 2007; Wigge et al., 2005). Other studies have also provided evidence that the FT protein is a mobile floral signal transmitted from leaves to the shoot apex (Jaeger and Wigge, 2007; Lifschitz et al., 2006; Notaguchi et al., 2008) via phloem. (Aki et al., 2008; Giavalisco et al., 2006; Lin et al., 2007)
Reproductive onset is a crucial step in the development and adaptation of trees. Studying reproductive onset at the molecular level provides us an understanding of how trees adapt and survive, as well as how to breed more efficiently for various ecological and economic traits(Brunner et al., 2004). A homolog to FT, FLOWERING LOCUS T1 (FT1), was recently identified in poplar (Populus sp.) (Bohlenius et al., 2006; Hsu et al., 2011). Overexpression of FT1 induced reproductive onset within several months in juvenile poplar (Hsu et al., 2011). The FT1 gene was activated in response to low temperature in winter and determined the reproductive fate of axillary meristems on preformed shoots enclosed in vegetative buds(Hsu et al., 2011). Warming temperatures in spring rapidly suppressed FT1 transcription, ending reproductive onset and marking the developmental beginning of reproductively determined meristems into flower buds. Homologs of CONSTANS (CO) in poplar (CO1 and CO2) did not appear to be involved in reproductive onset(Hsu et al., 2012), one of the major differences between Arabidopsis and poplar. This is perhaps because FT in Arabidopsis is regulated by day length, whereas FT1 in poplar is regulated by temperature, suggesting different evolutionary tracks for annual and perennial species.
Reproductive onset in poplar often occurs at ages between 3 and 10 years in seed grown plants. Although a large phenotypic variation in reproductive onset exists in poplar(Braatne et al., 1996), no research has yet been conducted to determine the underlying mechanisms for this variation. This critical gap in the knowledge base stems from the lack of an appropriate gene involved in reproductive onset and a suitable poplar population with large phenotypic variation in reproductive onset. To enable future large-scale polymorphism studies, the aim of this study was to identify sequence variation in the FT1 locus in a small population of P. deltoides with varying reproductive onset.
Genetic variation in transcription factors and transcription factor binding sites plays a major role in phenotypic variation within species and divergence between species(Brunner and Beers, 2010). Using the identified polymorphisms in the FT1 locus, a larger population of P. deltoides with known phenotypes can be genotyped to conduct an association study to statistically assess the link between polymorphism in the FT1 locus and phenotypic variation in reproductive onset. This is an important step towards developing reliable genetic markers to assist breeders in selection of early or late reproducing trees at early ages.
2 Materials and Methods
2.1 Plant materials
Axillary and terminal buds of P. deltoides were used as plant material. Fourteen P. deltoides genotypes were planted and grown in a common garden in a Department of Forestry research facility at Mississippi State University..All genotypes were taken from several locations in the USA and planted with 5 replicate to MSU garden in 2008. The selected genotypes showed early or late onset of reproduction based on field observations beginning 2008. Tissues were collected and placed in liquid nitrogen from the selected population in January of 2012.
2.2 Genomic DNA isolation
Genomic DNA was isolated from 14 genotypes using a DNeasy Plant Mini Kit (Qiagen, Valencia, CA). 100-200 mg of bud tissue was ground in liquid nitrogen and gDNA was isolated according to manufacturer's instruction. Following DNA isolation, the samples were quantified using Spectronic Biomate 3 UV-Visible Spectrometer (Themo Spectronic, Rochester, NY).
2.3 PCR amplification
PCR was performed to amplify the FT1 locus from genomic DNA. Locus-specific forward and reverse primers (Table 1) were designed and used to amplify the protein coding region and introns (Table 2). Total PCR volume per reaction was 50 μL, containing 100-200 ng of genomic DNA, 1.25 units of Ex Taq polymerase (Takara Mauntain View, CA), 4 μL of 2.5 mM dNTPs, 1 μL of 10 µM forward and reverse primers, and 10X reaction buffer. PCR amplification was performed using the Eppendorf Mastercycler epgradientS PCR system (Eppendorf, Westbury, NY).
|
Table 1 Primer sequences for PCR amplification and sequencing of FT1 locus (exons and introns) |
.png)
|
Table 2 The sequence used for designing the primers flanking FT1 locus |
.png)
To amplify the regions, the initial denaturation of DNA was set at 95°C for 2 min, followed by 35 cycles of denaturation at 95°C for 30 s, primer annealing at 58°C for 30 s, extension at 72°C for 4 min, and with final extension at 72°C for 5 min. The amplified PCR products were analyzed using the agarose gel electrophoresis technique. The gel was viewed under UV in a gel documentation system to visualize the DNA bands. The desired DNA fragments were isolated from the gel using the QIAEX II gel extraction kit (Qiagen, Valencia, CA).
2.4 Gene cloning and Sequences analysis
pGEM®-T Easy vector system (Promega, Madison, WI) was used for cloning the PCR product of FT1. Ingredients were mixed gently and incubated at 4°C overnight following manufacturer’s instructions. The cells were heat-shocked for transformation, and LB + Ampicillin plates were used for selection. For each P. deltoides genotypes at least three colonies were selected for sequencing. Plasmids containing the FT1 genomic DNA were isolated using the QIAGEN Plasmid mini kit (Qiagen, Valencia, CA). Sequencing was performed following the manufacturer’s instructions using the CEQ 8000 DNA Sequencer genetic analysis system (Beckman Coulter, Brea, CA). The Dye Terminator Cycle Sequencing using the Quick Start Kit (Beckman Coulter, Fullerton, CA) was used. T7 and SP6 primers were used to obtain the external part of the regions in the sequencing. Other primers were designed to sequence the internal regions of the second and third introns (Table 1).
2.5 Expression analysis
Total RNA was extracted from 5 genotypes using the RNeasy Plant Mini Kit (QIAGEN, Valencia, CA). The RNA was mixed with 5 μLDNase I (Promega, Madison, WI), 7 μL DNase I 10X reaction buffer, and 10 μL ddH2O. The reaction mixture was incubated at 37°C for 30 min and purified following the clean-up procedure described in the RNeasy Mini kit (Qiagen, Valencia, CA). In each genotype, RNA from 3 biological replicates were isolated and used for qRT-PCR. First-strand cDNA was generated from 0.5 µg of RNA for each sample using random hexadeoxynucleotide primers according to the protocol provided with SuperScript II reverse transcriptase (Invitrogen, Carlsbad, CA). qRT-PCR was run on an iQ5 thermal cycler (Bio-Rad, Hercules, CA) using the Bio-Rad SYBR green Supermix kit (Bio-Rad, Hercules, CA) according to the manufacturer’s specifications. The PCR mixture (20 µL) contained 0.5 µL of 10 µM (each) forward and reverse primers, 10 µL of 2x SYBR green Supermix, and 1 µL of undiluted cDNA. The thermal program was 95°C for 3 min, 45 cycles of three steps (95°C for 15 s, 62°C for 30 s, and 72°C for 30 s) and a final extension of 72°C for 3 min ending with a melt curve program, 0.5°C increase every 15 s from 60°C to 95°C. The ∆∆Ct method (Livak and Schmittgen, 2001) was used for calculations, and the expression of Ubiquitin was used as an internal control for normalization of FT1 gene expression. A one-way Analysis of Variance (ANOVA) test was conducted on qRT-PCR data to indicate statistically significant differences (P = 0.0213) (SAS 9.1.3, SAS Inc., USA).
2.6 Identification of polymorphic regions
Using the Lasergene software (DNASTAR, Madison, WI), multiple sequence alignments were conducted to identify single nucleotide polymorphisms (SNPs), small insertions or deletions (indels, ≤50 bp), and structural variants (>50 bp). Assembly and alignment of sequences were performed using the MegAlign program of the Lasergene software (DNASTAR, Madison, WI). If a particular SNP was found in more than three genotypes, it was called “true.” The P. deltoides genotypes showing similar patterns of clustered polymorphism, the relationship between the genotypes and their phenotypes, were examined based on that polymorphism. For this purpose, the multiple sequence alignment, a neighbor-joining phylogenetic tree, was conducted using the Clustal X method(Saitou and Nei, 1987). Pairwise and multiple alignment parameters were set independently. Gap opening and gap extension were set at 35 and 0.75, respectively, for pairwise and at 15 and 0.3, respectively, for multiple alignment. The parameter for delay divergent sequences in multiple alignments was set to 25%. TreeView was used to visualize the phylogenetic tree. (Page, 1996) Bootstrap analysis based on 1000 replicates was conducted to show the support among nodes.
3 Results
3.1 Early and late reproducing genotypes were determined
Phenotypes of 14 P. deltoides genotypes differing in timing of reproductive onset are shown in Figure1. As of spring 2014, seven genotypes first reproduced at age 3, three genotypes reproduced at age 5, and the other four genotypes had not yet reproduced (Figure 1). Based on these observations, 10 genotypes were assigned to the “early reproducing group,” whereas the other four were assigned to the “late reproducing group.”
|
Figure 1 The reproductive groups of Populus deltoides genotypes in population Note: First group is the early reproducing group- trees flowered at the age of 3 and at the age of 5-, and second group is late reproducing genotypes which are not flowered yet. Blue boxes represent male genotypes, and pinks are female genotypes. All trees were planted in 2008 and observed until spring 2014 |
.png)
3.2 Polymorphisms located in introns
An approximately 3.3 kb region of FT1, consisting of four exons and three introns, was sequenced from the 14 P. deltoides genotypes (Figure 2A). Coding and intron sequences were compared among the genotypes to identify SNPs. While no SNPs were located in coding regions, several SNPs were found in all three introns (Figure 2B).
|
Figure 2 Schematic structure of the FT1 locus and SNP analysis in 14 Populus deltoides genotypes Note: A. The re-sequenced 3kb FT1 genomic region contains four exons and three introns. B. SNPs in intron 1, intron 2 and intron 3 were identified |
.png)
Two of the 9 SNPs located led to transitions, the first transition region being the 484th from the beginning ATG as a change between A and G. There were two additional regions (906th and 1244th) with changes between C and T. Six SNPs led to transversions, and in four regions (257th, 2253rd, 2257th and 2415th) the variation was between A and T. In another two regions, the 1122nd and 2844th, changes were between A and C. The frequency of SNPs identified was approximately one per 362 bp in the population (~3 260 total nucleotide bp/9 SNPs).
In the intron 2 site; there were two indel sites identified. The first was located in an AT rich region and was 26 bp long. The second indel site was found in 2 genotypes, Pd10917 and AC97-18, and was 11 bp long. This indel was
not correlated with different reproduction phenotypes – one genotype (PD10917) was early and another (AC97-18) was late reproducing. In intron 3, the first indel was located at the beginning of the intron sequence, was seen only in one genotype (Pd-F02-OP), and was 33 bp long. The second indel was in the middle of intron 3. This was also an AT rich region as in intron 2, and was 23 bp long (Figure 3).
|
Figure 3 Ilustration of indels in intron 2 and 3 regions with schematic structure of FT1 gene Note: On the top two regions of indels are shown, and in the bottom another two region of indels are shown. Dashes show missing nucleotide |
.png)
3.3 Phylogenetic analysis
The very early reproducing genotypes (flowered by age 3) clustered in the middle of phylogenetic tree in 2 clusters; however, a clear separation between early and late reproducing genotypes based on polymorphisms in introns of FT1 was not evident. Although phylogenetic analysis showed three clusters, late and early reproducing genotypes were intermixed throughout the tree (Figure 4). This suggests that there was no significant correlation between the SNPs/indels and the phenotypes.
|
Figure 4 Phylogenetic tree of early and late reproducing genotypes based on polymorphisms in intron of FT1 Note: If there is difference in sequence of alleles, an individual allele was shown separately in Phylogenetic tree. Bootstrap percentages (n=1000) are located at nodes |
.png)
3.4 Expression Analysis
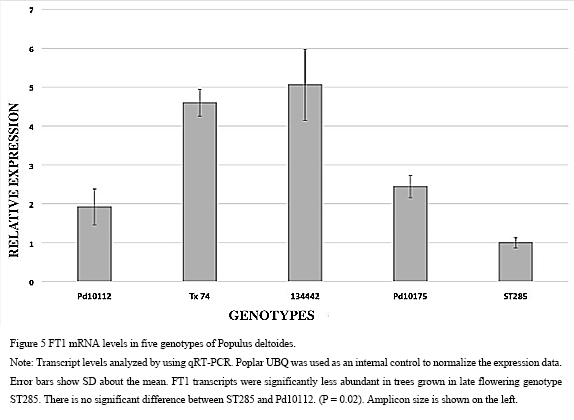
The results indicated significant differences in relative gene expression between the early and late flowering (P=0.0213) in selected 5 genotypes (Figure 5). The lowest expression was in genotype ST285 (+1 fold). The other genotypes displaying higher expression were Tx74, Pd10175, 134442 and Pd10112 which increased slightly by +4.59-fold, +2.44-fold, +5.06-fold and +1.92-fold, respectively (Figure 5). The difference between ST285 and TX74 was statistically significant, as was the difference between ST285 and Pd10175. A similar pattern followed between ST285 and 134442 (P<0.05) whereas there was no significant difference between ST285 and Pd10112.
|
Figure 5 FT1 mRNA levels in five genotypes of Populus deltoides Note: Transcript levels analyzed by using qRT-PCR. Poplar UBQ was used as an internal control to normalize the expression data. Error bars show SD about the mean. FT1 transcripts were significantly less abundant in trees grown in late flowering genotype ST285. There is no significant difference between ST285 and Pd10112. (P = 0.02). Amplicon size is shown on the left |
4 Discussions
4.1 Polymorphisms located in introns
The frequency of SNP identified in this study was one per 362 bp in the population. This frequency seems low when compared to other studies. For example, observed frequencies in other species include one SNP per 100 bp in maize (Zea mays), (Rafalski, 2002) one per 77 bp in cotton (Gossypium spp.) (An et al., 2008), and one per 45.7 bp in sunflower (Helianthus annuus) (Kolkman et al., 2007). SNP frequency found in soybean (Glycine max) (one SNP every 273 bp) (Zhu et al., 2003)was similar to that in this work. SNP in the genus Populus shows variation among species. The rate of polymorphism was found to be one SNP per 130 bp in P. trichocarpa (Gilchrist et al., 2006) and one per 60 bp in P. tremula(Ingvarsson, 2005). In other tree genera (e.g. Pinus, Eucalyptus, Chamaecyparis) SNP rates have been estimated to be between 2 to 16 SNPs per 1,000 bp(Nehra et al., 2005). Consequently, the SNP rate found in this study is somewhat lower than that found in other poplar studies, as well as studies of other tree species. The small sample size of 14 genotypes and examining only one locus could have affected the SNP frequency observed in this study. Although phylogenetic analysis showed late and early reproducing genotypes were intermixed throughout the tree (Figure 4), the very early reproductive genotypes (at the age of 3) are located in the middle of phylogenetic tree in between 2 clusters (134442, ST-261, TX-74, and TX 8-1). We can think that the observation might link between SNPs/indels and very early flowering phenotypes.
4.2 Expressions and Phylogenetic Analysis
Expression analysis showed that the FT1 transcript was expressed at a higher level in early flowering genotypes (TX74 and 134442) than in the others. Even though genotype Pd10112 was considered an early flowering genotype, the FT1 expression level was lower than other early flowering genotypes. Late flowering genotype ST285, which had not flowered by the date of this analysis, had the lowest FT1 expression level. These results in conjunction with a prior study (Hsu et al, 2011) support the contention that expression of the FT1 gene controls the timing of reproductive onset in poplar such that higher expression levels result in earlier flowering.
Our phylogenetic analysis did not clearly separate the two groups of flowering phenotypes using SNP and insertion-deletion sites. However, the very early flowering genotypes are clustered together by a separation from late flowering genotypes and those genotypes flowering at the age of 5. Phylogenetic analysis provided evidence for a link between the polymorphisms and the phenotypic differences with respect to reproductive onset among the 14 genotypes. It does not exist any previous report correlated between early flowering and SNP or Indel element in FT1 locus of P. deltoides. However, a QTL analysis was done in soybean, and a marker found in small population (Yamanaka et al., 2005). The author concluded that a single FT1 locus affected the flowering time, and line Linkage analysis had shown that the FT1 locus mapped with single Mendelian factor between two tightly linked DNA markers (Yamanaka et al., 2005).
Adaptation is an important trait for the study of allelic variation. Genetic variation and fitness are the basis for the ability of forest tree populations to adapt to different environments(Krutovsky and Neale, 2005). Trees species are commonly challenged by dynamic environmental conditions, thus, adaptive genetic variation in relevant genes and phenotypic plasticity are essential for their long-term adaptation to stressful conditions. The timing of reproductive onset is an important adaptive trait, which appears to be controlled primarily by the FT1 locus in poplar.
Sequence variation at the FT1 locus was identified in a small population of P. deltoides with varying phenotypic expression in reproductive onset. Our contention is that some deletion sites of the late flowering genotypes may have a binding site to some regulatory elements which regulate flowering time in poplar trees. This study will help to understand the genetic basis of phenotypic variation in reproductive onset in P. deltoides, and whether deletion-insertion sites could be candidates for breeding selection tools.
Funding
This work was funded by the National Science Foundation (IOS-0845834).
Acknowledgements
We are grateful to Dr. Chuan-Yu and Dr. Cetin Yuceer for excellent assistance. Special thanks go to Dr. Onder Tor for assistance with data and statistical analyses. Ali Akgul also acknowledges the support of the Turkish Government fellowship.
Abe M, Kobayashi Y, Yamamoto S, Daimon Y, Yamaguchi A, Ikeda Y, Ichinoki H, Notaguchi M, Goto K, Araki T. 2005. FD, a bZIP protein mediating signals from the floral pathway integrator FT at the shoot apex. Science 309, 1052-1056
http://dx.doi.org/10.1126/science.1115983
Aki T, Shigyo M, Nakano, R Yoneyama T, Yanagisawa S. 2008. Nano scale proteomics revealed the presence of regulatory proteins including three FT-Like proteins in phloem and xylem saps from rice. Plant & cell physiology 49, 767-790.
http://dx.doi.org/10.1093/pcp/pcn049
An C, Saha S, Jenkins JN, Ma DP, Scheffler BE, Kohel RJ, Yu JZ, Stelly DM. 2008. Cotton (Gossypium spp.) R2R3-MYB transcription factors SNP identification, phylogenomic characterization, chromosome localization, and linkage mapping. Theoretical and applied genetics 116, 1015-1026.
http://dx.doi.org/10.1007/s00122-008-0732-4
An H, Roussot C, Suarez-Lopez P, et al. 2004. CONSTANS acts in the phloem to regulate a systemic signal that induces photoperiodic flowering of Arabidopsis. Development 131, 3615-3626.
http://dx.doi.org/10.1242/dev.01231
Ayre BG, Turgeon R, 2004. Graft transmission of a floral stimulant derived from CONSTANS. Plant physiology 135, 2271-2278.
http://dx.doi.org/10.1104/pp.104.040592
Bohlenius H, Huang T, Charbonnel-Campaa L, Brunner AM, Jansson S, Strauss SH, Nilsson O. 2006. CO/FT regulatory module controls timing of flowering and seasonal growth cessation in trees. Science 312, 1040-1043.
http://dx.doi.org/10.1126/science.1126038
Braatne J, Rood SB, PE. 1996. Biology of Populus and its Implications for Management and Conservation. NRC Research Press. Chapter 5, 113-118.
Brunner AM, Beers EP. 2010. Transcription Factors in Poplar Growth and Development. In, Genetics, Genomics and Breeding of Poplar. Science Publishers Press. Chapter 8, 192-230.
http://dx.doi.org/10.1016/j.tplants.2003.11.006
Brunner AM, Busov VB, Strauss SH. 2004. Poplar genome sequence: functional genomics in an ecologically dominant plant species. Trends in Plant Science 9, 49-56.
Corbesier L, Vincent C, Jans S, et al. 2007. FT Protein Movement Contributes to Long-Distance Signaling in Floral Induction of Arabidopsis. Science 316, 1030-1033.
http://dx.doi.org/10.1126/science.1141752
Giavalisco P, Kapitza K, Kolasa A, Buhtz A, Kehr J. 2006. Towards the proteome of Brassica napus phloem sap. Proteomics 6, 896-909.
http://dx.doi.org/10.1002/pmic.200500155
Gilchrist EJ, Haughn GW, Ying CC, et al. 2006. Use of Ecotilling as an efficient SNP discovery tool to survey genetic variation in wild populations of Populus trichocarpa. Molecular ecology 15, 1367-1378.
http://dx.doi.org/10.1111/j.1365-294X.2006.02885.x
Hsu CY, Adams JP, Kim H, et al. 2011. FLOWERING LOCUS T duplication coordinates reproductive and vegetative growth in perennial poplar. Proceedings of the National Academy of Sciences of the United States of America 108, 10756-10761.
http://dx.doi.org/10.1073/pnas.1104713108
Hsu CY, Adams JP, No K, et al. 2012. Overexpression of CONSTANS homologs CO1 and CO2 fails to alter normal reproductive onset and fall bud set in woody perennial poplar. PloS one 7, e45448.
http://dx.doi.org/10.1371/journal.pone.0045448
Ingvarsson PK. 2005. Nucleotide polymorphism and linkage disequilibrium within and among natural populations of European aspen (Populus tremula L., Salicaceae). 169, 945-953.
Jaeger KE, Wigge PA. 2007. FT protein acts as a long-range signal in Arabidopsis. Current biology 17, 1050-1054.
http://dx.doi.org/10.1016/j.cub.2007.05.008
Kardailsky I, Shukla VK, Ahn JH, Dagenais N, Chrustensen SK, Nguyen JT, Chory J, Harrison MJ, Weigel D. 1999. Activation tagging of the floral inducer FT. Science 286, 1962-1965.
http://dx.doi.org/10.1126/science.286.5446.1962
Kobayashi Y, Kaya H, Goto K, Iwabuchi M, Araki T. 1999. A pair of related genes with antagonistic roles in mediating flowering signals. Science 286, 1960-1962.
Kolkman JM, Berry ST, Leon AJ, et al. 2007. Single nucleotide polymorphisms and linkage disequilibrium in sunflower. Genetics 177, 457-468.
http://dx.doi.org/10.1534/genetics.107.074054
Krutovsky KV, Neale DB. 2005. Nucleotide diversity and linkage disequilibrium in cold-hardiness- and wood quality-related candidate genes in Douglas fir. Genetics 171, 2029-2041.
Lifschitz E, Eviatar T, Rozman A, Shalit A, Goldshmidt A, Amsellem Z, Alvarez JP, Eshed Y. 2006. The tomato FT ortholog triggers systemic signals that regulate growth and flowering and substitute for diverse environmental stimuli. Proceedings of the National Academy of Sciences of the United States of America 103, 6398-6403.
http://dx.doi.org/10.1073/pnas.0601620103
Lin J, Gunter LE, Harding SA, Kopp RF, McCord RP, Tsai CJ, Tuscan GA, Smart LB. 2007. Development of AFLP and RAPD markers linked to a locus associated with twisted growth in corkscrew willow (Salix matsudana 'Tortuosa'). Tree physiology 27, 1575-1583.
http://dx.doi.org/10.1093/treephys/27.11.1575
Livak KJ, Schmittgen TD. 2001. Analysis of relative gene expression data using real-time quantitative PCR and the 2(-Delta Delta C(T)) Method. Methods 25, 402-408.
http://dx.doi.org/10.1006/meth.2001.1262
Mathieu J, Warthmann N, Kuttner F, Schmid M. 2007. Export of FT protein from phloem companion cells is sufficient for floral induction in Arabidopsis. Current biology 17, 1055-1060.
http://dx.doi.org/10.1016/j.cub.2007.05.009
Nehra NS, Becwar MR, Rottmann WH. et al. 2005. Forest biotechnology: innovative methods, emerging opportunities. In Vitro Cellular & Developmental Biology-Plant 41, 701-717.
http://dx.doi.org/10.1079/IVP2005691
Notaguchi M, Abe M, Kimura T, Daimon Y, Kobayashi T, Yamaguchi A. 2008. Long-distance, graft-transmissible action of Arabidopsis FLOWERING LOCUS T protein to promote flowering. Plant & cell physiology 49, 1645-1658.
http://dx.doi.org/10.1093/pcp/pcn154
Page RDM. 1996. Tree View: An application to display phylogenetic trees on personal computers. Computer Applications in the Biosciences. 12, 357-358.
http://dx.doi.org/10.1093/bioinformatics/12.4.357
Pin PA, Nilsson O. 2012. The multifaceted roles of FLOWERING LOCUS T in plant development. Plant, cell & environment 35, 1742-1755.
http://dx.doi.org/10.1111/j.1365-3040.2012.02558.x
Rafalski A. 2002. Applications of single nucleotide polymorphisms in crop genetics. Current opinion in plant biology. 5, 94-100.
http://dx.doi.org/10.1016/S1369-5266(02)00240-6
Saitou N, Nei M. 1987. The neighbor-joining method: a new method for reconstructing phylogenetic trees. Molecular Biology and Evolution 4, 406-425.
Tamaki S, Matsuo S, Wong HL, Yokoi S, Shimamoto K. 2007. Hd3a protein is a mobile flowering signal in rice. Science 316, 1033-1036.
http://dx.doi.org/10.1126/science.1141753
Wigge PA. 2011. FT, a mobile developmental signal in plants. Current Biology 21, R374-378.
http://dx.doi.org/10.1016/j.cub.2011.03.038
Wigge PA, Kim MC, Jaeger KE, Busch W, Schmid M, Lohmann JU, Weigel D. 2005. Integration of Spatial and Temporal Information During Floral Induction in Arabidopsis. Science 309, 1056-1059.
http://dx.doi.org/10.1126/science.1114358
Yamanaka N, Watanabe S, Toda K, Hayashmi M. et al., 2005. Fine mapping of the FT1 locus for soybean flowering time using a residual heterozygous line derived from a recombinant inbred line. TAG. Theoretical and applied genetics. Theoretische und angewandte Genetik 110(4):634-639.
Zhu YL, Song DL, Hyten CP, et al. 2003. Single-nucleotide polymorphisms in soybean. Genetics 163, 1123-1134.


. PDF(590KB)
. FPDF(win)
. HTML
. Online fPDF
Associated material
. Readers' comments
Other articles by authors
. Ali Akgul
. Ayfer Akgul
. Scott D. Roberts
. Richard L. Harkess
. Susan V. Diehl
Related articles
. Flowering
. FT1
. Poplar
. Populus deltoides
. Reproductive onset
. Sequence
Tools
. Email to a friend
. Post a comment