Plant genetic resources; diversity analysis, Capsicum species; population structure
Introduction
Chilli pepper belongs to the genus
Capsicum of the
Solanceae family. This genus contains 31 species of which five,
C. annuum L.,
C. chinense Jacq.,
C. frutescens L.,
C. baccatum L.and
C. pubescens Ruiz & Pav.aredomesticated (
Moscone et al., 2006). Pepper is the most widely used spice and one of the important vegetable crops in the world. In Eritrea, pepper is used on both dry and fresh forms in almost all traditional dishes. The average weekly household consumption of dry pepper is estimated at 140 grams (
Saleh et al., 2013). It is consumed as powder prepared from dry pods called ‘
berbere’, which is added to dishes as a food dye and spice. The dry red pods are also one of the main ingredients of the chickpea-based ‘
shiro’ powder, a popular sauce in Eritrea, while green pods are eaten raw as a salad or appetizer (
Saleh et al., 2013). Pepper is one of the four most widely grown vegetable crops in Eritrea. The total cultivated area under pepper in 2010 was estimated at 2 873.55 ha and the production was 21 010 tons with an average yield of 7.3 tons/ha of green pepper (
Ministry of Agriculture, 2011). In the last ten years, Eritrea has shown a continuous increase in both area under pepper and production, while productivity declined from 10.1 t/ ha in 2003 to 7.3 in 2010 (
Ministry of Agriculture, 2011).
The study of genetic variation among individuals, groups of individuals or populations is a pre-requisite for plant breeding. Knowledge about germplasm diversity and genetic relationships among breeding materials informs crop improvement strategies. It allows exploration of variability in available traits of interest within the population under study (
Mohammadi and Prasanna, 2003). Molecular markers are useful tools for diversity studies, and are usually more reliable than morphological markers. Random amplified polymorphic DNA (RAPD) was one of the most popular markers used.
Baral and Bosland (2002) and
Sanatombi et al. (2010), used RAPDs for diversity studies of germplasm from Nepal and India. RAPDs were also used for characterizing and comparing genetic structure of landraces (
Votava et al., 2005) and wild versus domesticated populations (
Oyama et al., 2006). Similarly, Amplified Fragment Length Polymorphism (AFLP) markers were useful to reveal genetic diversity among pepper genotypes from Ethiopia compared to germplasm from other countries (
Geleta et al., 2006).
Simple sequence repeats (SSR) markers also called Microsatellites are tandem repeated motifs of 1-6 nucleotides abundant in most eukaryotic and prokaryotic genomes (
Kalia et al., 2011). More recently these markers have become more widely used in genetic studies of pepper and other plants. The information value of microsatellites is high compared to AFLPs and RAPDs (
Lee et al., 2004). SSR markers are co-dominant, stabile, with capacity of multi-allelic detection, ease of application, excellent sensitivity and transferability (
González-Pérez et al., 2014). They have been widely used in many plant species including cereals, vegetables and fruits for genetic diversity studies, population genetics and evolutionary studies, as well as genome analysis, gene mapping and marker-assisted selection (
Kalia et al., 2011).
González-Pérez et al. (2014) described microsatellites to have proven superior power than other markers in resolving population structure and still remain very attractive for breeding purposes.
The use of SSR markers in genetic studies of capsicum varied from constructing linkage maps (
Lee et al., 2004;
Mimura et al., 2012), complement tests of distinctiveness (
Kwon et al., 2005), genetic diversity and structure (
Aguilar-Meléndez et al.; 2009,
Rai et al., 2013;
Dhaliwal et al., 2014). In the current study 28 SSR markers obtained from the Asian Vegetable Research and Development Centre, the world vegetable centre (AVRDC) were used. The objectives were to determine the genetic diversity and population structure of local Eritrean pepper germplasm collected from farmers and research institutions and to evaluate its relatedness to accessions obtained from Ethiopia, India, Italy, Mexico and Kenya.
1 Results
1.1 Genetic diversity
A total of 352 alleles were detected. The number of alleles per locus (Na) ranged from 6 in AVRDC-PP49 and AVRDC-PP129 to 48 alleles in AVRDC-PP147. Thirteen markers revealed 6 to 10 alleles and 6 revealed 15 to 48 alleles. Average number of alleles per marker was 13. Mean major allele frequency (MAF) ranged from 0.17 (AVRDC-PP67) to 0.93 (AVRDC-PP129) with an average of 0.48 (
Table 1). Mean polymorphic information content (PIC) ranged from 0.13 for AVRDC-PP129 to 0.89 for AVRDC-PP67 with an average of 0.62. Only 3 markers (AVRDC-PP129, AVRDC-PP146 and CA519548) of the 28 had PIC value of less than 0.5, while 10 markers had 0.7 or greater PIC value (
Table 1). Populations varied in total number of alleles, mean number of alleles per locus and number of private alleles. The highest number of alleles per population (Na) and highest mean number of alleles per locus (MNa) was found in Gindae (228 and 8.14 respectively) followed by Mendefera (190 and 6.96), while the lowest numbers were found in population KALRO1 (63 and 2.25). The AVRDC population had the highest number (20) of private alleles, followed by Gindae (18) and Mendefera (17), while the lowest number of private allele were 1 (found in KALRO1) and two alleles (found in Elabered, Dubarwa and Akurdat). The populations showed high % polymorphic loci, which was 100% in seven populations, while in the remaining five populations it ranged from 82.14 in KALRO1 to 96.43 in Dubarwa (
Table 2).
.png)
Table 1 Extent of genetic diversity revealed by parameters using the 28 SSR marker
|
.png)
Table 2 Allelic distribution pattern within population
|
Partitioning of the molecular variance of the populations under study (
Table 3), showed that 10% of the variation occurred among the populations, while 30 and 60 % occurred among individuals and within individuals. The variation in all three partitions was highly significant (P< 0.001).
.png)
Table 3 Summary AMOVA showing the variability patterns of the collection relative to populations
|
1.2 Genetic dissimilarity among population
Genetic distance among populations was determined by using the Nei genetic distance (
Nei ,1972) matrix (
Table 4). The KALRO populations that included 3 peppers (KALRO1) and 8 tomatoes (KALRO2) were the most distant compared to almost all other populations. The outgroup population, KALRO2, with mean distance of 0.83 and ranging from 0.70 – 0.95 showed the highest genetic distance, followed by KALRO1 with mean 0.39 and ranged from 0.270 –0.825. Among the Eritrean populations Mendefera with mean genetic distance 0.36 was the most distant to KALRO2 (0.95). It showed also a relatively high genetic distance with all other populations except Gindae (0.12) and Dekemhare (0.11).
.png)
Table 4 Pairwise Population Matrix of Nei Genetic Distance
|
Similarly Akurdat with mean genetic distance 0.346 was the most distant to KALRO1 (0.46) and showed a relatively high genetic distance with all other populations except distant to KALRO1 (0.46) and showed a relatively high genetic distance with all other populations except Afabet (0.13), HAC (0.17) and NARI (0.20).Afabet with the lowest mean genetic distance (0.22) showed also the lowest genetic distance with almost all populations ranging from 0.06-0.70. Low dissimilarity was observed in three groups; these are Elabered, Dbarwa and Gindae (0.07, 0.09 and 0.11), Dekemhare, Mendefera and Gindae (0.11, 0.07 and 0.12) and Afabet, NARI and HAC (0.08, 0.06 and 0.01). The last group showed also the lowest distant to AVRDC (0.15, 0.16 and 0.13) among the Eritrean populations (
Table 4).
1.3 Population structure
Figure1 displays factor analysis using dissimilarity distance matrix, considering axes 1 and 2. The two axes explained a total variation of 14.3 % (7.53 % for axis 1 and 6.79% for axis 2). Genotypes were grouped into three main clusters in addition to a small fourth cluster. Genotypes collected from farmers in Eritrea separated into two clusters. Cluster 1 is mainly composed of individuals from sub-population Gindae, Elabered, Dubarwa, 8 individuals from Afabet and few from Mendefera and Dekemhare. Likewise, Cluster 2 is mainly composed of individuals from Gindae, Mendefera and Dekemhare, 11 from Afabet and 3 from Akurdat. All the individuals belonging to samples collected from institutions in Eritrea (HAC and NARI) and abroad (AVRDC and KALRO) and more than 50% from Afabet clustered together in Cluster 3. However, five of the eight genotypes of the outgroup (Tomato) and few genotypes each from AVRDC, Gindae, Mendefera, Elabered and Akurdat separated into a small cluster (Cluster 4) located between clusters 2 and 3. This clustering pattern was confirmed by neighbour joining method (
Figure 2). Overall, the local Eritrean peppers showed the same clustering pattern like the factor analysis method except that 2 individuals from NARI and 6 from HAC moved from cluster 3 to clusters 1 and 2 (
Figure 2). However, the major difference between the two methods was that genotypes from AVRDC and KALRO populations joined clusters 1 and 2 respectively. KALRO2 (the outgroup) joined cluster 2 and formed a distinct group in sub-cluster IV that included four improved AVRDC varieties and one from each Mexico and Ethiopia in addition to one genotype from KALRO1 and a few local genotypes. Similarly, 12 individuals from AVRDC moved from cluster 3 to cluster 1 forming with some Eritrean germplasm sub-cluster II. AVRDC materials in this sub-cluster included 5 Ethiopian, 3 Italian, 2 Mexican and 2 improved varieties (
Figure 2). Cluster 3 comprised four sub-clusters. The first sub-cluster (sub-cluster V) was the major sub-cluster composed of individuals from HAC, NARI and Afabet, in addition to few individuals from AVRDC, KALRO1 and Dekemhare. The second sub-cluster (sub-cluster VI) comprised 11 individuals from Afabet,two from NARI and one from each Gindae and Elabered. The third sub-cluster (sub-cluster VII) was composed of 23 individuals from AVRDC and only two local genotypes from Dubarwa and Dekenhare. The AVRDC germplasm in this sub-cluster included all the Indian and the majority of the Italian accessions. HAC also formed a small sub-cluster (Sub-cluster VIII) composed of five individuals (
Figure 2).
.png)
Figure 1 Factor analysis showing grouping of the 407 individuals on axis 1 and 2
|
.png)
Figure 2 Neighbour joining tree showing clustering of the 407 individuals
|
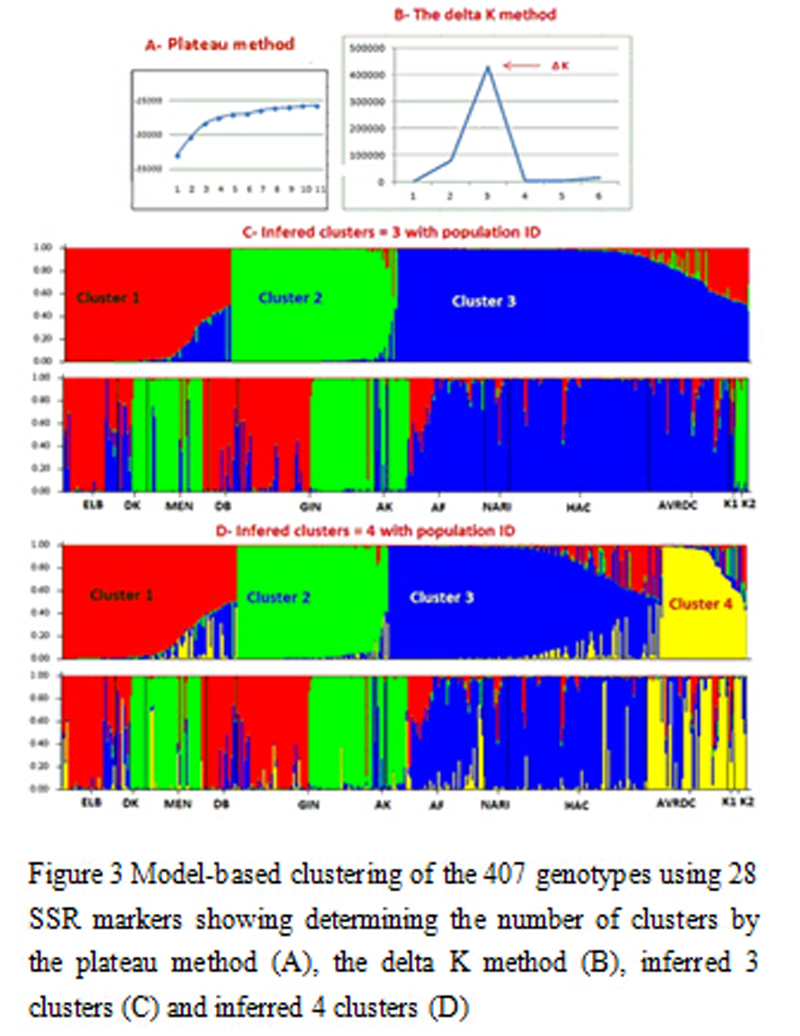
The ad hoc value ∆K ran from Structure showed high likelihood value that confirmed the existence of three clusters (
Figure 3) as previously inferred by the factor analysis (
Figure 1) and the neighbour joining tree (
Figure 2). The assignment of individuals into the three clusters was in agreement with factor analysis. This was slightly different in the tree constructed from dissimilarity matrix using Dar Win in which only 62.5% of AVRDC individuals inferred into cluster 3 compared to 90% according to the model based method (
Figure 3) and 100% with factor analysis (
Figure 1).
Figure 3 shows that at least 90% of the genotypes from the three institutions viz HAC (97%), NARI (91%) and AVRDC (90%) inferred together in cluster 3. Only 3% from HAC and 8% each from NARI and AVRDC inferred in cluster 1.
.png)
Figure 3 Model-based clustering of the 407 genotypes using 28 SSR markers showing determining the number of clusters by the plateau method (A), the delta K method (B), inferred 3 clusters (C) and inferred 4 clusters (D)
|
According to the model based structure (
Figure 3 and
Table 5), Afabet was the only population collected from farmers that had most individuals (64%) inferred in cluster 3, while 13 and 22% were inferred to clusters 1 and 2 respectively. Most of the materials from Dbarwa and Elabered (85 and 80% respectively) inferred to cluster 1, while 15 and 19% from the previous populations were inferred to cluster 3. Majority of genotypes from Gindae and Akurdat inferred to clusters 1 and 2 and cluster 2 and 3 respectively.
.png)
Talbe 5 Proportion of each pre-defined population in each of the 3 or 4 inferred clusters
|
Only 7% of individuals from Gindae inferred to cluster 3 and 1% from Akurdat inferred to cluster 1. Half of the Dekemhare population was inferred in cluster 2, while the remaining 50% was equally divided between cluster 1 and 3 (
Table 5). Cluster 1 consisted of 86 individuals collected from sub-regions Gindae (39), Elabered (22) and Dbarwa (15) and few genotypes from Mendefera (4), Dekemhare (2), Afabet (3) and AVRDC (1). An admixture group of 36 genotypes was also found in this group. Cluster 2, included 96 individuals, basically composed of materials collected from Gindae (37) and Mendefra (26), in addition to 12 from Afabet, 9 from Dekemhare and 4 from Akurdat. This cluster also contained all the 8 tomato outgroup genotypes. The admixed group of this cluster was very small compared to the other two clusters. Cluster 3 was the largest and comprised 188 individuals and an admixed group of 36 individuals. This cluster comprised genotypes from the 11 sub-populations, however, the major constituents are materials from HAC, AVRDC, NARI and sub-region Afabet. Of the total number of genotypes collected from HAC, 80 inferred to this cluster. Similarly, 13 from NARI and 42 from AVRDC and 35 from Afabet inferred to this cluster. Other individuals included 3 each from Elabered, Dekemhara, Gindae, Akurdat and Mendefera, 2 from KALRO1 and 1 from Dbarwa.
Expanding the number of clusters to 4 resulted in moving 63% of AVRDC, 51% of KALRO1 and 82% of KALRO2 populations to form its own cluster. Ancestry of the first two populations in cluster 1 remained almost similar, 9% for AVRDC and 24% for KALRO1 compared to the previous 8% and 21% respectively, while for KALRO2 it declined from 7% to 4%. However, both AVRDC and KALRO1 maintained strong ancestry in cluster 3 (27% and 24% respectively), while for KALRO2 the average proportion was lower (11%). A part from this, the remaining populations clustered the same in the three clusters (
Table 5). Raising the number of clusters beyond 4 showed no remarkable change.
Based on membership proportion of 0.60 or greater, percentage of individuals assigned to each cluster and their ancestry varied from given population to another. Frequency of individuals from Elabered, Dbarwa and Gindae assigned to cluster 1 was 69%, 83% and 48% at an average membership proportion of 0.98, 0.94 and 0.94 respectively. The remaining individuals were assigned to either cluster 2 or 3 or have parents from each (Supplementary
Table 4). Frequency of individuals from Mendefera, Dekemhare, Gindae, Akurdat and KALRO2 assigned to cluster 2 was 75%, 50%, 45%, 57% and 87.5% at membership proportion of 0.99, 0.97, 0.98, 0.84 and 0.94 respectively. Similar to the above the remaining individuals were assigned to either cluster 2 or 3 or have parents from each (Supplementary
Table 4). Frequency of individuals from Mendefera, Dekemhare, Gindae, Akurdat and KALRO2 assigned to cluster 2 was 75%, 50%, 45%, 57% and 87.5% at membership proportion of 0.99, 0.97, 0.98, 0.84 and 0.94 respectively. Similar to the above the remaining individuals were assigned to either cluster 1 or 3 or have one parent from each (Supplementary
Table 4). Frequency of individuals from Afabet, NARI, HAC, AVRDC and KALRO1 was 60%, 93%, 96%, 88% and 66% at membership proportion of 0.92, 0.95, 0.98 0.96 and 0.80 respectively with the remaining of individuals in each population assigned to cluster 1 or 2 or have one parent from each (Supplementary
Table 4).
High heterogeneity among individuals of the same genotype was observed. In this study three individual plants from each seed sample were collected as sampling strategy. The three individual plants of the same seed sample clustered distantly in the same or different clusters. None of the three plants was similar confirming the morphological variability observed during seed collection. However, variable distances were observed. Populations collected from institutions were more uniform compared to those collected from farmers (
Figure 2).
Average number of effective individual migrants (Nm) for the total population was relatively high (2.25). The pairwise population Nm (
Table 6) ranged from 0.98 between Dbarwa and Akurdat to 10.45 between Dekemhare and Gindae (excluding the tomato, KALRO2). Overall, gene flow among population in the same cluster was very high compared to among populations in different clusters (
Table 6).
.png)
Table 6 Pairwise population Nm values based on Fst values
|
2 Discussion
2.1 Genetic diversity
Genetic diversity parameters showed that the SSR markers used in this study were in agreement or more informative compared to many studies in pepper and other crops. Of the amplified markers 97.2% were polymorphic and only one marker (AVRDC PP117) was monomorphic. This polymorphism rate was similar to the results reported by
Oh et al. (2012) and in pepper and
QI-Lun et al. (2008) in maiz who used 22 and 45 SSR markers and obtained 100% and 96.3% polymorphism respectively.
However, it was very high compared to many previous studies in pepper (
Dhaliwal et al. 2014 and
Rai et al. 2013) who used 50 and 103 markers and reported 54% and 24.3% polymorphism respectively. In eggplant,
Munoz-Falcón et al. (2011) used 17 genomic SSRs in and obtained 82.3% polymorphism.
Diversity indicators performed by the 28 markers of the current study, viz allele richness, polymorphic information content (PIC), and Observed heterozygosity (H
o) were similar or much higher compared to many previous studies using SSR and other markers in pepper and other crops. Total number of alleles (352) and average number of alleles per marker (13) obtained in this study were slightly higher compared to that reported by
González-Pérez et al. (2014) who analyzed 39 markers and obtained a total of 381 alleles and an average of 9.8 alleles per locus, but much higher compared to
Dhaliwal et al. (2014) and
Oh et al. (2012), who reported average number of alleles per marker and total number of alleles in pepper to be 75 and 2.78 and 29 and 3.22 respectively. Similarly,
Sow et al. (2014)) reported in rice 178, and 9.89. However the results were lower compared to average number of alleles (18.21) reported in pepper by
Nicolai et al. (2013) and total number and average number of alleles reported in grape (499 and 22.68) by
Emanuelli et al. (2013). These differences could be due to the set of samples used in the current study was smaller compared to the last two reports (
González-Pérez et al. 2014).
Mean and range of PIC recorded by the current study was 0.62 and 0.13-0.89 respectively. This was similar to previous reports of SSR markers in pepper (
González-Pérez et al. 2014;
Dhaliwal et al., 2014;
Rai et al., 2013; and
Lee et al., 2004) and in rice (
Sow et al., 2013). However, the results of the current study are higher than reports in pepper (
Oh et al., 2012 and
HanáÄek et al., 2009). PIC values take into account the number of alleles and their distribution, thus determine informativeness of markers (
González-Pérez et al. 2014). In the current study only three markers showed PIC value less than 0.5 indicating that the set of SSR markers used were highly informative. Average observed heterozygosity (Ho) of the current study was 0.41. This was comparable to the reports of
Oh et al. (2012) in pepper and
QI-Lun et al. (2008) in maize, and higher than SSR in pepper (
Nicholaï et al., 2013 and
Ibiza et al., 2012) and rice (
Sow et al., 2014).
Ibiza et al. (2013) justified the low Ho obtained in their study by tendency of
Capsicum species to self-pollinate. However, since out-cross in
Capsicum is very high and pepper in Eritrea is mainly produced by small holding farmers who grow different varieties in close proximity to each other which favours cross-pollination; the high Ho obtained in the current study is justified.
Variation among populations was relatively low (10%) and most variation in the total population was within individuals (60%) and among individuals within populations (30%). This was similar to the 12% among populations reported by
Tesfamichael et al., (2014) studying Eritrean sorghum landraces but in contrast to the 31% and 57% within individuals and among individuals respectively reported in the same study. The results also are in contrast with the findings of
Backes et al., (2009) who reported within field variation in Eritrean barley to be 97.3 %. There is no documentation on when pepper was introduced it Eritrea, but oral reports indicate that it has been grown in for very long time (
Saleh et al., 2013). Selection of superior genotypes, carrying it over generations and acquiring seeds from trusted farmers within the village or distant places are common practices of pepper growers in Eritrea. This gives a chance for variants to be selected and fixed which may explain the relative high heterozygosity (
Table 1) and availability of rare alleles(
Table 2) leading to existence of significant amount of diversity within Eritrean pepper germplasm.
2.2 Pair wise genetic dissimilarity among population
Generally, the results indicated low dissimilarity among populations compared to the results of
Geleta et al., (2005) who compared Ethiopian pepper genotypes each other and with genotypes from AVRDC and other countries using AFLP markers. In the current study, two groups appeared to have low genetic distance (
Table 4) and high average number of effective individual migrants (
Table 6).The first group is composed of the populations Afabet, HAC and NARI. The genetic distance between Afabet and HAC was 0.056, Afabet and NARI was 0.079 and HAC and NARI was 0.071. This group was closer to the AVRDC population than to the rest of the Eritrean populations. Compared to the other populations, this group also showed closest distance with the KALRO1 and the outgroup KALRO2 (tomato) populations. The most probable reason for the close genetic distance among the three populations (Afabet, HAC and NARI) is that breeding lines from NARI are from local sources and served as source of seed for Afabet. Later on, breeding program started at HAC and benefited from the available local sources. This is evident from the high Nm levels among the three populations that ranged from 7.976 between Afabet and HAC to 8.144 between NARI and HAC (
Table 6). The second group is composed of Gindae, Dbarwa, Medefera, Dekemhare and Elabered, with genetic distance ranging from 0.086 between Gindae and Dekemhare to 0.117 between Gindae and Mendefera. This group had higher distance with AVRDC ranging 0.20-0.302 with Gindae and Mendefera respectively. Compared to the previous group, this group was also highly dissimilar with both KALRO1 and KALRO2. The close distance in this group could be due to intensive seed exchange among farmers in these areas. The high level of immigration observed among these populations expressed by the Nm is evidence for that. The highest Nm was 10.499 between Dekemhare and Gindae followed by Nm= 9.777 between Elabered and Dubarwa (
Table 6).
2.3 Population structure
Based on the Neighbor-joining clustering and STRUCTURE, the populations under study were grouped into three clusters, and increasing the number of populations in STRUCTURE resulted in forming a separate cluster for the non-Eritrean accessions. This is in contrast to similar study conducted in Nepal where all the local accessions clustered in a single cluster (
Baral and Bosland, 2002). Most of the breeding lines and large number of farmer varieties from the sub-region Afabet grouped together in cluster 3. The reason could be that breeding lines in both NARI and HAC are as a result of mass selection from an original local seed source in two separate breeding programs. Afabet is a new pepper production area, farmers in this area acquired seeds from different sources, therefore lines from NARI that have been released to farmers may be found in this area and crossed with genotypes from other sources. A breeding program started at HAC using local seed sources and continued to select superior genotypes to meet market requirements. Later on, selection by farmers led to genotypes with common ancestry to be selected. Majority of the AVRDC genotypes inferred in this cluster primarily; into a separate sub-cluster. Similarly, the individuals from Afabet clustered in a separate sub-cluster similar to genotypes from HAC and NARI which clustered also in smaller groups indicating of variability within the cluster (
Figure 2).
Baral and Bosland (2002), found that clustering of pepper accessions collected from diverse geographical and ecological features in Nepal did not cluster according to geographical region. In studying
C. annuum accessions from 89 countries
Nicolaï et al. (2013) also found that geographic origin was not clearly visible in clustering genotypes.
González-Pérez et al. (2014) also found partial influence of geographic origin in clustering Spanish pepper. A similar condition was observed in the current study, geographic and agro-climatic factors seem to have some influence but were not preponderant in clustering the landraces collected from farmers. Sub-region Gindae is one of the oldest pepper growing areas. Genotypes of the Gindae population have been collected from three distinct areas, viz a midland area (Gindae town and Dongolo), a lowland area (Damas) and two new production areas near to the coast. Majority of the genotypes from Damas clustered in cluster 1 with genotypes from Elabered (Midland) and Dbarwa, (highland) which are located in the Anseba and Debub administrative regions respectively. The three areas are distantly located from each other therefore, acquiring seed from common ancestry or movement of seed among the three areas could be the main reason of this close relationship. On the other hand the remaining genotypes from the midland and coastal areas of Gindae clustered with genotypes from Mendefera and Dekemhare in cluster 2. Both Mendefera and Dekemhare are highland areas located adjacent to each other, but relatively far away from Gindae. However, seed exchange among farmers in the three areas is common practice. Thus clustering of germplasm of the three areas together could be partially due to influence of geographic factors but mainly due to seed exchange or common ancestry. The Nm values (
Table 6) and ancestry levels of farmer varieties from these areas (
Table 4) supports the influence of seed exchange and common ancestry factors for clustering of these materials.
One genotype (NRSG28) from the coastal area of Gindae inferred to cluster 3 at 98.9% ancestry level, this is a breeding line from the Red-long of NARI that inferred to the same cluster at ancestry level of 99%. Gahteilay, another breeding line of Red-long was also inferred to the same cluster at similar ancestry level. This indicates that the 28 SSR markers used in this study were specific enough to group closely related genotypes together at high ancestry level.
The genomes of tomato and pepper are similar, but a typical number of common types of chromosomal rearrangements differentiate the genomes of tomato and pepper (
Livingstone et al. 1999).
Dias et al., (2013) reported that a dendrogram generated using data from 26 ISSR primers used for evaluating four pepper species and tomato as outgroup separated tomato from the pepper species. However, although
C. annuum,
C. fruitiscens and
C. chinense belong to the same complex and
C. baccatum to a different complex, the same dendrogram clustered
C. chinense away from its complex, while
C. baccatum clustered with the annuum complex. In the current study, although mean genetic distance between tomato and the other pepper populations was much greater (0.829) compared to 0.29 among the pepper populations, the eight tomato genotypes did not cluster separately from pepper, instead inferred with the pepper genotypes to cluster 2 but appeared distinct within sub-cluster IV (
Figure 2). The reason could be due to weak number of genotypes representing the tomato so it is maintained as distinct group within the closest cluster (
Nicolaï et al. 2013) or the set of 28 SSR markers were not specific enough to distinguish tomato as a separate species.
Afabet is an isolated area which is difficult to access. Commercial pepper production in Afabet started recently, not more than 15-17 years ago (
Saleh et al., 2013). Kubkub and Naro-Ans are the two villages active in pepper production. Only few kilometres separate them, but all genotypes of Kubkub except one inferred to cluster 3 (
Figure 2). NRSAF19 B is the only one from Kubkub that inferred with some of Naro-Ans genotypes to cluster 1, but was separate in sub-cluster II (
Figure 2). The Naro-Ans genotypes divided into two equal groups each with 13 genotypes and were grouped in clusters 1 and 2. Only two genotypes (NRSAF11 A and NRSAF11 C) of Naro-Ans were closer to Kubkub genotypes and inferred to cluster 3. It is obvious that inferring the 58 genotypes from Afabet into three clusters indicates that they are from three different ancestry. However, the findings of
Votava et al., (2005) can explain the relationship among individuals in each group. In Afabet 85% of the farmers prefer to save and use their own seed and they grow pepper in small plots (Maximum of 2 ha and minimum of 0.015) usually adjacent to each other (
Saleh et al., 2013). Thus the genotypes that cluster together have either a relatively narrow gene pool or they are derived from the same sources, and now share sufficient genetic characteristics to cluster together due to growing in close proximity (
Votava et al., 2005). The case of NRSAF19 B, NRSAF11 A and NRSAF11 C is mostly a migration situation.
González-Pérez et al. (2014) reported that grouping of genotypes from Spain was according to fruit shape and size which was not in agreement with the current study. Red long, Red short, Gahteilay, Chocolate, Group1A and Group1B are breeding lines from NARI. The first four are of triangular shaped and for dry consumption while the last two are with elongated slim fruits and used for fresh consumption. Red long, Gahteilay and chocolate are similar in fruit shape and size but differ in fruit color. Due to the differences in fruit characteristics, it was expected that individuals for the dry consumption group would cluster together and those of fresh consumption group cluster separately or with other genotypes of similar characters. However, one variant of Red long (Red long A) and Group 1A clustered in the same sub-cluster while, the rest two variants (Red long B & C), Chocolate and Group 1B A clustered in another sub-cluster, and Gahteilay and Red short grouped in a separate sub-cluster. A similar condition was observed with HAC genotypes. HD0083A &B and HD0023B (Dry) grouped with HG0018A (Fresh) in a sub cluster far away from all other HAC genotypes. This indicates that fruit size, shape and color had no effect in genotype clustering in the current study. The first reason could be due to SSR markers measuring genetic variation mainly in non-coding area, which has a minor impact on phenotypic characters (
Kwon et al., 2005). Secondly, association between marker loci and quantitative trait loci (QTLs) is necessary for correlation between molecular and phenotypic characters (
Burstin and Charcosset 1997). Thus it is possible that the 28 markers could not capture the regions of these characters. However, since each of the NARI and HAC breeding lines are a result of mass selection, out crossing may had happened so that genotypes of each group shared common gene pool to cluster together.
Due to the seed system and selection methods followed by farmers, high heterogeneity within cultivars is common in Eritrea for major crops.
Backes et al., (2009) reported high heterogeneity within small fields of barley and described it as striking results compared to modern barley fields. Similarly
Asgedom et al., (2011) found non-uniformity within tomato varieties maintained by farmers in Eritrea and mentioned it unusual for true to type varieties. In Eritrea pepper is mainly produced by small holding farmers in land size as small as 0.015 ha who usually keep their own seed by selecting the best plants in the field (
Saleh et al., 2013). In the current study three individual plants were sampled from each seed sample and each analyzed separately. The three individual plants clustered in different or the same cluster but none of them was identical to each other indicating heteroginity within genotype. Since pepper is a self-pollinating crop with high outcross, the high heterogeneity observed within the genotypes is expected. This was similarly found with
HanáÄek et al. (2009) in pepper,
QI-Lun et al., (2008) in maize who analysed 3 and 12 samples of each cultivar or landrace respectively.
Both plateau and delta K methods and the neighbour joining clustering proved the existence of three clusters. However,
Pritchard et al. (2012) indicated that the aim should be targeting the smallest value of K that can capture the best structure. In the current study raising the number of clusters to 4 moved all the AVRDC and KALRO genotypes into a separate cluster leaving the three clusters to be almost purely for Eritrean genotypes. This indicates the richness of genetic diversity and availability of considerable amount of unique alleles in Eritrean pepper.
3 Conclusion
There is considerable amount of variation among Eritrean pepper genotypes and the level of variation could be enough for supporting future breeding programmes. Absence of systematic introduction of improved varieties for long period, and continuous selection by farmers for more than a century may have created a chance for mutations to be selected and result in divergence gene pools different from those observed in the reference materials, and also existence of considerable amount of private alleles unique to Eritrean populations. These alleles may be a useful source for some characteristics. Thus, future strategy for pepper breeding in Eritrea could rely on local Eritrean germplasms unless specific traits, not locally available, are targeted. However, the seed system should also be revised so that improved varieties can be introduced to farmers fields and farmers trained how to maintain pure lines of their germplasm considering maintenance of the existing diversity.
4 Materials and Methods
4.1 Plant material
A total of 129 seed samples were collected from farmers and institutions in Eritrea in 2012. Thereafter, an additional 17 accessions from AVRDC, one pepper and three tomato accessions from Kenyan Agriculture and Livestock Research Organization (KALRO) were added (
Table 7). Samples from Eritrea were chosen to cover areas where farmers have saved their own seed for long periods as well as from major pepper growing areas focusing on geographical coverage and agro- ecological diversity (
Table 7).AVRDC materials were selected to represent, 1) Ethiopia where germplasm exchange took place across the border for a long period, 2) Italy from where many varieties were introduced to Eritrea, 3) India which is probably a source of the first peppers supplied to Eritrea and 4) Mexico which is considered the centre of diversity in addition to improved varieties developed in AVRDC. Due to variation observed within sample collections during the survey and seed collection as well as morphological characterization, three individual plants from each seed collection was applied as a sampling strategy for genotyping. However, due to seed viability constraint, in some cases only one or two plants from each were used, therefore a total of 407 individual plants were genotyped.
.png)
Table 7 Population, location of seed collection, number of seed samples and number of individuals genotyped
|
Farmer seed samples were collected from individual farmers in 24 sub-regions of 4 administrative regions of Eritrea (
Table 7). Villages from where seed was collected in each sub-region are in close distance ranging from 4 to 10 Km except in Gindae where the villages are in three distinct areas; Midland, lowland and coastal areas. Most farmers are small scale farmers who grow pepper in close proximity to each other in lands usually less than one hectare and as small as 0.015 ha. The collected seed materials are not named varieties or named landraces but kind of heirlooms maintained by farmers through selecting the best pods or plants and transferred from generation to the next. These are exchanged among farmers within the village, sub-region and beyond. Under such conditions genotypes has an opportunity to interbreed and create a common gene pool leading to formation of populations. Thus samples collected from each sub-region are considered as a population. The term farmer variety will be used for describing each seed sample collected from an individual farmer. Breeding lines of each NARI and HAC (
Table 7) are a result of mass selection from local seed in two independent breeding programs, germplasm of each of the two institutions has its own common ancestor, therefore each represents a population. Detailed information of each collected seed sample is provided in the supplementary
Table 1,
Table 2 and
Table 3.
4.2 DNA extraction
The
Mace et al. (2003) protocol with some minor modifications was used for DNA extraction. Seventy mg of leaf samples stored at -80oC was cut into small pieces and placed in 12 x 8 strip tubes and macerated in the presence of DNA extraction buffer (100 mM Tris-HCl [pH 8], 1.4 M NaCl, 20 mM EDTA, CTAB [2-3% w/v], DDT [0.03-3% v/v]) using a Geno/Grinder 2010 (Spex Sampleprep), followed by chloroform-isoamylalcohol (24:1) extraction, DNA precipitation, purification and resuspension in TE.The amount and the quality of genomic DNA were determined using a Nanodrop (Thermoscientific) and 1% agarose gel electrophoresis.
4.3 Genotyping
Gradient PCR was used to optimize conditions for the 44 fluorescent-labelled SSR markers obtained from AVRDC. A gradient of 11 temperatures from 50 to 60 oC was tested on two samples. All markers amplified SSR loci except five that were therefore excluded from the study. Of the remaining 39 markers, only 36 markers were used for amplification. The PCR conditions were initial denaturation at 95oC for 5 minutes followed by 35 cycles of 94oC for 30 seconds, annealing for 1 minute (
Table 8) and extension at 72 oC for 1 minute and final extension at 72 oC for 20 min. PCR products were examined on 2% agarose gels. Sets of 4 markers each with a different colour labels, were co-loaded and genotyped using the Genetic analyzer ABI 3730, (Applied Biosystems). Alleles were called using GeneMapper version 4.1 (Applied Biosystems). Out of the 36 markers eight were excluded because of unreliable peaks (AVRDC-PP17 and AVRDC-PP68) or having more than 10% missing data (AVRDC-PP83, AVRDC-PP86, AVRDC-PP117, AVRDC-PP135, AVRDC-PP137 and AVRDC-PP160) while the remaining 28 markers proceeded to statistical analysis of (
Table 8).
.png)
Table 8 Primer sequences, amplicon length, SSR motif and annealing temperature of the 28 markers used for the study
|
4.4 Data analysis
The 28 markers were analyzed with different software. PowerMarker (
Liu, 2001-2004) was used to determine gene diversity, heterozygosity, polymorphic information content, number of alleles in each marker and allele frequency. Genetic distance, Analysis of molecular variance (AMOVA), correlation, genetic dissimilarity and Number of effective emmegrants was calculated using GeneAlex (
Peakall and Smouse 2006, 2012). Darwin (
Perrier and Jacquemoud-Collet, 2006) was used for clustering the genotypes in a dendrogram or tree and for running factor analysis based on five axis. STRUCTURE version 2.3.4 (
Pritchard et al, 2012) was used for a model-based clustering for inferring population structure using genotype data. The program was used for demonstrating the presence of population structure, identifying distinct genetic populations and assigning individuals to populations. For inferring, number of populations (K) was set from 1 to 15 and the program ran 20 replicates for each K value at 10,000 burning speed and 50,000 Markov Chain Monte Carlo (MCMC) cycles. This was used for identifying the range of the true K value around 3. In addition, the program was run with setting K value 1 to 6 and a replicate of 20 for each K at burning in 500,000 repeats and MCMC replication of 750,000. K value was inferred using the L(K) method which is determined by identifying the point where the plateau starts (
Rosenberg et al. 2001) and confirmed by an ad hoc value (∆K) calculated using the formula below:
L(K) = an average of 20 values of Ln P(D),
L’(K) = L(K)n – L(K)n-1,
L’’(K) = L’(K)n – L’(K)n-1 and
∆K = [L’’(K)]/Stdv.
Authors’ contribution
Brhan K.Saleh designed the study, conducted the laboratory work, analysed the results and prepared the draft. Remmy W.Kasili, Eduard G.Mamati, Santie M.deVilliers, Aggrey B. Nyende all had input on the design and critically revised the manuscript. Kouadio N.Yao had scientific input in lab work, participation in data analysis and critically revised the manuscript. Woldeamlak Araia critically revised the manuscript.
Acknowledgment
The authors express gratitude to the ABCF program at the Biosciences eastern and central Africa (BecA), Nairobi for funding and hosting the laboratory work and the National Commission for Higher Education in Eritrea for funding the seed collection of the germplasm used in the study and the overall research program. Deep gratitude also to the World Vegetable Centre (AVRDC) for providing reference germplasm and SSR markers, Kenyan Agricultural and Animal Research Organization (KALRO), Nairobi, for contributing seed used as reference, Hamelmalo Agricultural College (HAC) and National Agricultural Research Institute (NARI) and farmers in Eritrea for provision of seed used in this study. Staff members of BecA, Institute for Biotechnology Research, JKUAT, Hamelmalo Agricultural College and Ministry of Agriculture, Eritrea for their support and contribution during the different stages of this work. Finally special thanks to Dr. Robert Skilton for his support and scientific contribution during the lab work.
Tesfamichael T.A., Githiri S.M., Kasili R.W., Skilton R.A., Solomon M., and Nyende A.B., 2014, Genetic Diversity Analysis of Eritrean Sorghum (Sorghum bicolor (L.) Moench) Germplasm using SSR Markers, Molecular Plant Breeding, 5
http://dx.doi.org/10.5376/mpb.2014.05.13
Aguilar M.A., Morrell P.L., Roose M. L., and Kim S.C., 2009. Genetic diversity and structure in semiwild and domesticated chiles (Capsicum Annuum ; Solanaceae) from Mexico. American Journal of Botany, 96(6): 1190-1202.
http://dx.doi.org/10.3732/ajb.0800155
Asgedom S., Vosman B., Esselink D., and Struik P.C., 2011, Diversity between and within farmers’ varieties of tomato from Eritrea. African journal of biotechnology, 10(12): 2193-2200
Asgedom S., Vosman B., Esselink D., and Struik P.C., 2011, Diversity between and within farmers' varieties of tomato from Eritrea. African journal of biotechnology, 10(12): 2193-2200
Backes G., Orabi J., Wolday A., Yahyaoui A., and Jahoor A., 2015, High genetic diversity revealed in barley collected from small-scale farmer' s fields in Eritrea, Genetic Resources and Crop Evolution, 56 (1): 85-97. doi:10.1007/s10722-008-9347-5
http://dx.doi.org/10.1007/s10722-008-9347-5
Backes G., Orabi J., Wolday A., Yahyaoui A., and Jahoor A., 2015, High genetic diversity revealed in barley collected from small-scale farmer ' s fields in Eritrea, Genetic Resources and Crop Evolution, 56 (1): 85-97, doi:10.1007/s10722-008-9347-5
http://dx.doi.org/10.1007/s10722-008-9347-5
Baral J., and Bosland P.W., 2002, Genetic Diversity of a Capsicum Germplasm Collection from Nepal as Determined by Randomly Amplified Polymorphic DNA Markers, J. Amer. Soc. Hort. Sci, 127(3):316-324
Burstin J., and Charcosset A., 1997, Relationship between phenotypic and marker distances: theoretical and experimental investigations, Heredity, 79 (5): 477-483
Dhaliwal M.S., Yadav A., and Jindal S.K., 2014, Molecular characterization and diversity analysis in chilli pepper using simple sequence repeats ( SSR ) markers. African Journal of Biotechnology, 13(31): 3137-3143
Dias G.B., Gomes V.M., Moraes T.M., Zottich U.P., Rabelo G.R., Carvalho A.O., and Da Cunha M., 2013, Characterization of Capsicum species using anatomical and molecular data, Genetetics and Molecular Research, 12: 6488-6501
http://dx.doi.org/10.4238/2013.February.28.29
Emanuelli F., Lorenzi S., Grzeskowiak L., Catalano V., Stefanini M., Troggio M., and Grando M.S., 2013, Genetic diversity and population structure assessed by SSR and SNP markers in a large germplasm collection of grape. BMC plant biology, 13(1): 39
http://dx.doi.org/10.1186/1471-2229-13-39
Geleta L.F., Labuschagne M.T., and Viljoen C.D, 2005, Genetic Variability in Pepper (Capsicum annuum L.) Estimated by Morphological Data and Amplified Fragment Length Polymorphism Markers, Biodiversity and Conservation, 14(10): 2361-2375
http://dx.doi.org/10.1007/s10531-004-1669-9
González-Pérez, S., Garcés-Claver, A., Mallor, C., de Miera, L. E. S., Fayos, O., Pomar, F., ... & Silvar, C. (2014). New Insights into Capsicum spp relatedness and the diversification process of Capsicum annuum in Spain. PloS one, 9(12), e116276.
http://dx.doi.org/10.1371/journal.pone.0116276
HanáÄek R., Vyhnánek T., Rohrer M., Cieslarová J., and Stavelikova H., 2009, DNA polymorphism in genetic resources of red pepper using microsatellite markers. Horticultural Science, 36(4): 127-132
Ibiza V.P., Blanca J., Ca-izares J., and Nuez F., 2012, Taxonomy and genetic diversity of domesticated Capsicum species in the Andean region. Genetic resources and crop evolution, 59(6): 1077-1088
Kwon Y., Lee J., Yi G., Yi S., Kim K., Soh E., and Kim B., 2005, Use of SSR Markers to Complement Tests of Distinctiveness, Uniformity, and Stability (DUS) of Pepper (Capsicum annuum L .), Varieties. Molecules and Cells, 19(3)
Lee J.M., Nahm S.H., Kim Y.M., and Kim B.D., 2004, Characterization and molecular genetic mapping of microsatellite loci in pepper. Theoretical and Applied Genetics, 108(4): 619-627.
Liu J., 2001-2004, PowerMarker software, version 3.25.
Livingstone K.D., Lackney V.K., Blauth J.R., Wijk R.Van, and Jahn M.K., 1999, Genome Mapping in Capsicum and the Evolution of Genome Structure in the Solanaceae. Genetics, 152: 1183-1202.
Mace E.S., Buhariwalla K.K., Buhariwalla H.K., and Crouch J.H., 2003, A high-throughput DNA extraction protocol for tropical molecular breeding programs. Plant Molecular Biology Reporter, 21(4): 459-459
Mohammadi S.A., and Prasanna B.M., 1990, REVIEW and INTERPRETATION Analysis of Genetic Diversity in Crop Plants Salient Statistical Tools, Crop Sceince, 43: 1235-1248.
Moscone E.A., Scaldaferro M.A., Grabiele M., Cecchini N.M., and Ehrendorfer F., 2007, The Evolution of Chili Peppers(Capsicum-Solanaceae): a Cytogenetic Perspective, Acta Hortic 745: 137-170.
Munoz-Falcón J.E., Vilanova S., Plazas M., and Prohens J., 2011, Scientia Horticulturae Diversity, relationships, and genetic fingerprinting of the Listada de Gandía eggplant landrace using genomic SSRs and EST-SSRs. Scientia Horticulturae, 129: 238-246.
http://dx.doi.org/10.1016/j.scienta.2011.03.034
Nei M., 1972, Genetic distance between populations. American Naturalist, 106: 283-392.
Nicolaï M., Cantet M., Lefebvre V., Sage-Palloix A.M., and Palloix A., 2013, Genotyping a large collection of pepper (Capsicum spp.) with SSR loci brings new evidence for the wild origin of cultivated C. annuum and the structuring of genetic diversity by human selection of cultivar types, Genetic Resources and Crop Evolution, 60(8): 2375-2390.
Oh S., Song J., Lee J., Lee G., Ko H., Stoilova T., Krasteva L., Kim Y., Rhee J., Gwag J., Ro N., Hur O., and Lee M., 2012, Evaluation of Genetic Diversity of Red Pepper Landraces (Capsicum annuum L.) from Bulgaria Using SSR Markers. Korean J. Intl. Agri., 24(5): 547-556.
Peakall R. and Smouse P.E., 2012, GenAlEx 6.5: genetic analysis in Excel. Population genetic software for teaching and research – an update, Bioinformatics, 28: 2537-2539.
Yao Q.L., Fang P., Kang K.C., and Pan G.T., 2008, Genetic diversity based on SSR markers in maize (Zea mays L.) landraces from Wuling mountain region in China, Journal of Genetics, 87(3): 287–291.
Rai V.P., Kumar R., Kumar S., and Rai A., 2013, Genetic diversity in Capsicum germplasm based on microsatellite and random amplified microsatellite polymorphism markers, Physiol Mol Biol, 19: 575-586
Saleh B.K., Nyende A.B., Kasili R., Mamati E., and Araia W., 2013, Current Status and Future Opportunities of Pepper Production in Eritrea, ARPN Journal of Agricultural and Biological Science, 8(9): 655-672
Sanatombi K., Sen-mandi S., and Sharma G.J., 2010, Scientia Horticulturae Short communication DNA profiling of Capsicum landraces of Manipur. Scientia Horticulturae, 124(3): 405-408
Sow M., Sido A., Mariac C., Laing M., and Bezançon G., 2014, Genetic diversity, population structure and differentiation of rice species from Niger and their potential for rice genetic resources conservation and enhancement, Genetic Resources and Crop Evolution, 61(1): 199-213
Votava E.J, Baral J.B., and Bosland P.W., 2005, Genetic Diversity of Chile (Capsicum annuum var. annuum) Landraces from Northern New Mexico, Collorado and Landraces. Economic Botany, 59(1): 8-17

 Author
  Correspondence author
.png)
.png)