Research Report
Assesment of Genetic Diversity in Wheat Synthetic Double Haploids for Yield and Drought Related Traits Through Factor and Cluster Analyses 
 Author
  Correspondence author
Plant Gene and Trait, 2016, Vol. 7, No. 3 doi: 10.5376/pgt.2016.07.0003
Received: 03 May, 2016 Accepted: 17 May, 2016 Published: 19 May, 2016
Imran J., Shahid I.A., Hafiz M.A., and Aurangzeb R., 2016, Assesment of genetic diversity in wheat synthetic double haploids for yield and drought related traits through factor and cluster analyses, Plant Gene and Trait, 7(3): 1-9 (doi: 10.5376/pgt.2016.07.0003)
Wheat is an important cereal crop of the world and its productivity has been limited by abiotic stresses. An experiment was conducted at the Department of Plant Breeding and Molecular Genetics, Faculty of Agriculture, The University of Poonch Rawalakot, to assess the genetic diversity for drought tolerance in synthetic wheat double haploids. On the bases of cluster analyses, the genotypes were divided into five main groups. Highest genetic distance was observed between double haploid1 and double haploid 17. Maximum Eigen value was obtained by factor I followed by factor II while it remained minimum in factor V. From factors analysis and on the base of specific numbers larger than 1, five factors were identified and they all together justified 83.22% variation among the studied characters. Maximum variance 37.94 was observed by factor I, while factor II, III, IV and V showed 16.09, 12.11, 8.73, 8.34% variance.
Introduction
Wheat is one of the most important food crops in the world, and its importance will increase with increasing the global population. In the world the largest cropped area is devoted to wheat that is more than 240 million ha (Curtis, 1982) and quantity produced is more than that of any other crop (Ahmad et al., 2014). In Pakistan wheat is being cultivated intensively in irrigated, arid and semi arid areas (Raza et al., 2015) and plays significant role in economic stability of the country. Abiotic stresses are the most significant causes of yield losses in plants and can reduce production about 50% (Qin et al., 2011). Among abiotic stresses, drought is the most prominent and widespread; consequently the drought stress response has been dissected into its components and extensively studied in order to understand tolerance mechanisms thoroughly (Kantar et al., 2011). Plant growth and productivity are greatly affected by environmental stresses such as drought, high salinity, and low temperature (Zheng et al., 2010). Drought tolerance is a quantitative trait, with complex phenotype and genetic control (McWilliam, 1989). Drought is a major abiotic stress that adversely affects wheat production and quality in many regions of the world, the loss of which is the total for other natural disasters, with increasing global climate change making the situation more serious (Shao et al., 2005; Kirigwi et al., 2007; Ahmad et al., 2015). Tolerance to drought is mostly conditioned by many of components responses, which interact and may be different for different crops, in relation to types, intensity and duration of water deficit (Hittalmani et al., 2003). The improvement of the yields under stress conditions therefore must combine the high yield potential and specific factors, which are able to protect the crop against reductions due to different stresses (László et al., 2002).
Genetic diversity analyses aids in classification of groups with possible utility for specific breeding goal (Ahmad et al., 2014). Genetic improvement to develop varieties with high yield potential and resistance/tolerance to abiotic and biotic stresses is the most viable and environment-friendly option to sustainably increase wheat yield (Ashfaq et al., 2014). The induction and regeneration of haploids followed by spontaneous or induced doubling of chromosomes are widely used techniques in advanced breeding programs of several agricultural species. Doubled haploid lines are considered attractive material for both plant breeders and geneticists because many of the problems associated with the assessment of segregating populations can be overcome by their usage. Moreover, doubled haploid technique saves at least three to four generations of self-pollination for the fixation of homozygous pure lines (Hassawi et al., 2005).
In our experiment we have applied simple and widely used field screening tests like water retention ability test of excised leaves (Clarke, 1982) in combination with grain yield and related traits to understand the drought tolerance in double haploids developed from synthetic wheat.
1 Results and Discussion
1.1 Statistical analysis
The principle component analysis and cluster analysis were performed with the help of computer software 'Statistica/w 6.0.' and 'SPSS' 20 for Windows by averaging mean values of two years. The means were standardized before analysis as Hair et al. (2006). K-means clustering of standardized data was used to identify the more significant level of discrimination between the clusters for each of variable. Then dendrogram was constructed based on Ward's method using Euclidean distance (Kumar et al., 2009).
1.2 Factor analysis
Factor analysis is used effectively to decrease the volume of data and to interpret the results of variables having higher correlation among primary variables (Cattell, 1965 and Cooper, 1983). So, the effective traits on each factor are identified and the factors are named according to the most effective characters (Harman, 1976; Tadesse and Bekele, 2001). Moghaddam et al. (1998), Mohamed(1999) and Ahmad et al.(2014) have used this analysis to identify the growth and yield related traits in wheat. Factor analysis can be complementary of regression and path coefficient analysis and presents additional information (Azizi et al., 2001).
The eigen values are often used to determine how many factors to retain. The sum of the eigen values is usually equal to the number of variables. By means of major factors analysis and on the base of specific numbers larger than 1, five factors were identified and they all together justify 83.22% variation among the characters (Table 1). Maximum variance 37.94 was observed by factor I, while factor II, III, IV and V showed 16.09, 12.11, 8.73, 8.34% variance relatively. Mohamed(1999) reported that grain yield and spike density accounted 80.8% variation in wheat genotypes. Similarly Leilah and Al-Khateeb reported that yield, biomass and harvest index factor accounted for 74.4% variation in wheat genotypes.
|
Table 1 Principal components for drought tolerance traits in wheat |
.png)
Factor loadings for drought tolerance traits in wheat double haploids (Table 2). From the results of factor analysis it was observed that first factor has large and positive factorial coefficients for spike length (0.87), spike lets (0.83) and biological yield (0.78) where as lowest negative coefficients for harvest index and specific leaf area (-0.30) hence this factor can be called effective factor for spike characteristics. The second factor has large and positive coefficients for specific leaf weight (0.91) residual transpiration (0.76), and spikelets (0.17). In third factor large and positive coefficient observed for relative water content (0.77) and it may be determined as relative water content factor. In factor IV tillers showed the highest value (0.70) followed by relative water content (0.37) and lowest negative values of dry weight, fresh weight and osmotic adjustment. Factor V showed maximum value of specific leaf area and lowest values of residual transpiration, relative water content, specific leaf weight, spike length and 1000 grain weight. Table 3 determined means, standard deviations and variances for clusters based on morpho- physiological traits in wheat double haploids. From all five clusters the mean value of residual transpiration was higher in cluster II where as the mean of relative water content was higher (76.53) in cluster III. Highest mean value for flag leaf dry weight was (0.43) in cluster V. Maximum mean for tillers was observed (7.70) by cluster II. Maximum mean for 1000 grain weight was observed (41.24) by cluster V. In previous research Dehghani et al. (2008), Protić et al. (2009), and Hailegiorgis et al. (2011) have reported similar results in wheat using multivariative analyses.
|
Table 2 Factor loadings of drought tolerance traits in wheat double haploids |
|
Table 3 Means, standard deviations and variances for clusters based on drought tolerance traits in double haploid wheat |
.png)
1.3 Cluster analyses
Cluster analysis is used to sort out different objects into groups in such a way that if they belong to same group, degree of association between them will be maximum and minimal otherwise. On the bases of cluster analyses, to find the correlation for drought related traits among wheat double haploids all the members were divided in five clusters (Table 4). Cluster I contained 4 members while cluster II, III, IV and V were consisting of 6, 5, 3 and 4 members, respectively. The results are agreed with Narouee (2006) who determined the genetic diversity of wheat landraces in the west of Iran and by using cluster analysis. Bajracharya et al., 2006 characterized the rice plants on the bases of agronomical, morphological and physiological traits through the use of cluster analysis. Table 3 shows that the genotypes of cluster III were characterized with higher flag leaf dry weight, flag leaf fresh weight and osmotic adjustment, which reveals that genotypes of this group can exploited for the improvement of drought tolerance as reported by Ali et al., 2011 in sorghum. Dendrogram (Figure 1) demonstrated the association between studied traits of wheat double haploids. It has been observed that the main branch of dendrogram I is divided into two clusters (A, B) and these two clusters again divided into two sub clusters both (a, b).Both the sub clusters (A, a and B, a) was further divided into two more sub clusters (I, II) and showed that residual transpiration, specific leaf weight, dry weight, osmotic adjustment, hydrophilic collides and fresh weight are found in one group (A, a, I) and in (A, b) group leaf area, spike lets and biological yield are found. In cluster (B, a, I) relative water content, (B, a, II) plant height and in (B, b) specific leaf area, grain weight and harvest index are found. Mustafa et al. (2015) during their experiment on maize under drought conditions also reported that drought related traits were present on genotypes of same cluster. Fang et al. (1996) used 120 wheat genotypes of wheat and clustered them into five groups on the bases of morphological traits i.e date of maturity, plant height, spike length, seeds per spike, spike length, 1000 grain weight, and seed yield per spike and reported the same results. Figure 2 represents the linkage between wheat double haploids for drought related traits. Main branch of dendrogram II is divided into two clusters (A, B), both the clusters again divided into two sub clusters (a, b) from which cluster again divided into two sub clusters (I, II) that shows E1, E20, E3 and E18 are found in group (A, a, I) and are closely related in respect of drought tolerance. In cluster (A, a, II) E7, E12, E13 and E19, (A, b, I) E2, E6, E15, E4, E5, E8 and E11, (A, b, II) E9, E10 AND E14, (B, a) E16, E21 and E22, (B, b) E17 are found. From the Table 5 and Figure 2 it is observed that maximum genetic divergence was observed between DH1 and DH17 so cross between theses double haploids can be used for increasing the yield accordingly minimum genetic distance was found between DH1, DH 20 hence these synthetic double haploids can be used for backcross breeding programmes as reported by Rahim et al. (2010). Similar results were reported by Ali et al., 2008 for the improvement of wheat genotypes through cluster analysis.
.png)
|
Figure 1 Dendrogram based on morpho-physiological traits in wheat double haploids |
.png)
.png)
|
Figure 2 Dendrogram based on drought related traits in wheat double haploids |
.png)
2 Conclusions
Being the staple food of the country wheat is cultivated throughout the Pakistan and faces various stresses which eliminate the production of this crop. Optimal goal of plant breeders is increased yield potential with minimum inputs. The Principal component analysis and factor analysis are statistical techniques that are useful for the description of the relations that occur among bread wheat characteristics. This study will aid in identification, selection and combining the superior wheat double haploids to obtain drought resistant traits in one line with a broad genetic base so that wheat production may be enhanced in drought pruning areas.
3 Materials and Methods
The experiment was conducted in the Department of Plant Breeding and Molecular Genetics, Faculty of Agriculture, The University of Poonch Rawalakot. Seed of twenty two synthetic double haploid wheat genotypes was obtained from Wide Crosses Lab. National Agricultural Research Center, Islamabad (Table 6). The genotypes were sown into rows. Inter row and inter plant distances were maintained 30 cm and 15 cm respectively. Standard dose of fertilizer was applied to all the experimental units. To obtain an idea of drought tolerance about the genotypes, ten guarded plants were randomly selected from each of the entry. Data was recorded for days to 50% heading by visual observation, relative water contents, residual transpiration, osmotic adjustment, hydrophilic collides, flag leaf area, plant height, number of tillers per plant, spike length, number of spikelets per spike, 1000-grain weight, grain yield per plant, and harvest index. Relative water content (RWC) was determined for detached leaves using the method of Mata and Lamattina (2001). The residual transpiration (RT) was measured according to Clarke et al. (1991). The flag leaf dry matter (DW) was calculated by the average dry weight obtained from RT and RWC measurements, as:
DW (mg) = (DW1 + DW2)/2
Leaf area was taken with the help of portable leaf area meter (CI-202, CID, Inc, USA). The specific leaf weight (SLW) and specific leaf area (SLA) is calculated as:
SLW = DW/LA
SLA = LA/DW
Osmotic adjustment was determined by formula:
OA = TW-FW
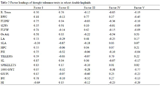
.png) Table 6 List of synthetic double haploid lines and their parentage |
Hygrophilic colloids were estimated indirectly by leaf powder method in order to assess its possible relationship with drought tolerance. The dried leaves of the above experiments of RT and RWC were recombined and ground to make fine powder with the help of electronic grinder. The grinder was thoroughly cleaned before grinding next sample in order to keep the samples pure. About 1g powder of each sample was subjected to 100% relative humidity in a small beaker of known weight. After 24 hours, the beakers were weighed again and the moisture absorbed was noted. Absorption in % age was calculated. Three such readings were recorded per entry and mean was computed.
Ahmad H.M., Awan S.I., Aziz O., and Ali M.A., 2014, Multivariative analysis of some metric traits in bread wheat (Triticum aestivum L.), Eurp. J. Biotech and Biosci., 1(3): 18-21
Ahmad H.M., Rahman M.U., Azeem F., and Ali Q., 2015, QTL mapping for the improvement of drought tolerance in cereal crops: A review. Life Sci. J., 12(4s): 102-108
Ali M.A., Jabran K., Awan S.I., Abbas A., Ehsanullah, Zulkiffal M., Acet T., Farooq J., and Rehman A., 2011, Morpho-physiological diversity and its implications for improving drought tolerance in grain sorghum at different growth stages, AJCS, 5(3): 311-320
Ashfaq S., Ahmad H.M., Awan S.I., Kang S.A., Sarfraz M., and Ali M.A., 2014, Estimation of genetic variability, heritability and correlation for some morphological traits in spring wheat. J. Biol. Agric & Healthcare, 4(5): 10-16
Awan S.I., Niaz S., Malik M.F.A., and Ali S., 2007, Analysis of variability and relationship among seedling traits and plant height in semi-dwarf wheat (Triticum aestivum L.), J. Agric. & Soc. Sci., pp.59–62
Azizi F., Rezaie A.M., Mir A.M., and Meibodi M., 2001, Evaluation genetic and phenotypic variation and factor analysis on morphological traits in bean genotypes, J. Sci.& Tech. of Agric. and N. Resources, 5: 127-140
Bajracharya J., Steele K.A., Jarvis D.I., Sthapit B.R., and Witcombe J.R., 2006, Rice landrace diversity in Nepal: Variability of agro-morphological traits and SSR markers in landraces from a high-altitude site, Field Crops Res., 95: 327-335
http://dx.doi.org/10.1016/j.fcr.2005.04.014
Cattell R.B., 1965, Factor analysis: an introduction to essentials. 1. The purpose and underlying models. Biometrics 21, 190-215
http://dx.doi.org/10.2307/2528364
Clarke J., 1982, Excised leaf water retention capacity as an indicator of drought resistance of Triticum genotypes, Can. J. Plant Sci., 62:571-576
http://dx.doi.org/10.4141/cjps82-086
Clarke J.M., Richards R.A., and Condon A.G.,1991, Effect of drought on residual transpiration and its relationship with water use of wheat, Can. J. Plant Sci., 71: 695-702
http://dx.doi.org/10.4141/cjps91-102
Cooper J.C.B., 1983, Factor analysis. An overview Am Statist, 37: 141-147
http://dx.doi.org/10.1080/00031305.1983.10482727
Cseuz L., János P., Zoltán K., János M., Péter F., Irma T., and László E., 2002, Wheat breeding for tolerance to drought stress at the Cereal Research Non-Profit Company. Proceedings of the 7th Hungarian Congress on Plant Physiology, Acta Biologica Szegediensis, 46(3-4): 25-26
Curtis B.C., 1982, Potential for a yield increase in wheat. In Proc. Natl. Wheat Res. Conf., Beltsville, MD, USA, 26-28 Oct., p. 5-19.
Dehghani D., Omidi H., Sabaghnia, N., 2008, Graphic analysis of trait relations of canola (Brassica napus L.) using biplot method, Agron. J., 100: 760-764
http://dx.doi.org/10.2134/agronj2007.0275
Hailegiorgis D., Mesfin M., and Genet T., 2011, Genetic divergence analysis on some bread wheat genotypes grown in Ethiopia, Journal of Central European Agriculture, 12: 344-352
http://dx.doi.org/10.5513/JCEA01/12.2.922
Hair J.F., Black W.C., Babin B.J., Anderson R.E., and Tatham R.L., 2006., Multivariate data analysis, 6th edition, Pearson Education Inc. and Dorling Kindersley Publishing Inc., pp. 923
Harman H.H., 1976, Modern Factor Analysis, 3rt Ed, University of Chicago Press, Chicago, pp: 376
Hassawi D.S., Qrunfleh I., and Dradkah N., 2005, Production of doubled haploids from some Jordanian wheat cultivars via anther culture technique, J. Food Agric. Environ., 3: 161-164
Hittalmani S., Huang N., Courtois B., Venuprasad R., Shashidhar H.E., Zhuang J.Y., Zheng K.L., Liu G.F., Wang G.C., Sidhu J.S., Srivantaneeyakul S., Singh V.P., Bagali P.G., Prasanna H.C., McLaren G., and Khush G.S., 2003, Identification of QTL for growth and grain yield-related traits in rice across nine locations of Asia, Theor. Appl. Genet, 107: 679–690
http://dx.doi.org/10.1007/s00122-003-1269-1
Kantar M., Lucas S. J., and Budak H., 2011, Drought stress: molecular genetics and genomics approaches, In: Turkan I, editor, Adv.in Bot. Res. Burlington, Mass, USA: Elsevier; pp.445–493
http://dx.doi.org/10.1016/b978-0-12-387692-8.00013-8
Kirigwi F.M., Ginkel M.V., Brown-Guedira G., Gill B.S., Paulsen G.M., and Fritz A.K., 2007, Markers associated with a QTL for grain yield in wheat under drought, Mol. Breed., 20: 401-413
http://dx.doi.org/10.1007/s11032-007-9100-3
Kumar B., Lal G.M., Ruchi and Upadhyay A., 2009, Genetic variability, diversity and association of quantitative traits with grain yield in bread wheat (Triticum aestivum L.), Asian J. Agric. Sci., 1(1): 4-6
Leilah A.A., and Al-Khateeb S.A., 2005, Statistical analysis of wheat yield under drought conditions, Journal of Arid Environments, 61: 483-496
http://dx.doi.org/10.1016/j.jaridenv.2004.10.011
Mata C.G., and Lamattina L., 2001, Nitric oxide induces stomatal closure and enhances the adaptive plant responses against drought stress, Plant Physiol, 126: 1196–1204
http://dx.doi.org/10.1104/pp.126.3.1196
McWilliam J., 1989, The dimensions of drought. In: Baker F, editor. Drought resistance in cereals, Wallingford, UK: CAB International, pp.1-11
Moghaddam M., Ehdaie B., and Waines J.G., 1998, Genetic variation for and inter-relationships among agronomic traits in landraces of bread wheat from southwestern Iran, J. Gene & Breed., 52 (1):73–81
Mohamed N.A., 1999, Some statistical procedures for evaluation of the relative contribution for yield components in wheat, Zagazig J Agric Res., 26 (2): 281-290
Mustafa H.S.B., Farooq J., Ejaz-ul-Hasan., Bibi T., and Mahmood T., 2015, Cluster and principle component analyses of maize accessions under normal and water stress conditions, J Agric. Sci., 60(1):33-48
http://dx.doi.org/10.2298/jas1501033m
Narouee R.M., 2006, Evaluation of genetic diversity and factor analysis for morphologic traits of wheat landraces of Sistan-Baloochestan. J Pajouhesh-va-Sazandegi in Persian, abstract in English, 73: 50-58
Protić R., Todorović G., and Protić N., 2009, Correlations of yield and grain yield components of winter wheat varieties, Journal of Agricultural Sciences (Belgrade), 54:213-221
http://dx.doi.org/10.2298/JAS0903213P
Qin F. K., Shinozaki and Yamaguchi-Shinozaki K., 2011, Achievements and challenges in understanding plant abiotic stress responses and tolerance, Plant and Cell Physiology, 52(9): 1569-1582
http://dx.doi.org/10.1093/pcp/pcr106
Rahim M.A., Mia A.A., Mahmud F., Zeba N., Afrin K., and Toor S., 2010, Genetic variability, character association and genetic divergence in Mungbean (Vigna radiate L. Wilczek), Plant Omic., 3: 1-6
Raza M.A., Ahmad H.M., Akram Z., and Ali Q, 2015, Evaluation of wheat genotypes for morphological traits under rainfed conditions, Academ Arena., 7(9): 19-26
Richards R.A, Condon A.G., and Rebetzke G.J., 2001, Traits to Improve Yield in Dry Environments, Reynolds, M.P., J.I. Ortiz-Monasterio, and A McNab (eds.), Application of Physiology in Wheat Breeding, Mexico, D.F.: CIMMYT., pp. 100
Shao H.B., Liang Z.S., Shao M.A., and Sun Q., 2005, Dynamic changes of anti-oxidative enzymes of 10 wheat genotypes at soil water deficits, Colloids and Surfaces B: Biointerfaces, 42: 187-195
http://dx.doi.org/10.1016/j.colsurfb.2005.01.011
Tadesse W., and Bekele E., 2001, Factor analysis of yield in grass pea (Lathyrus sativus L.), Lathyrus Lathyrism Newsletter, 2: 416-421
Zheng J., Fu F., Gou M., Huai J., Liu Y., Jian M., Huang Q., Guo X., Dong Z., Wang H., and Wang G., 2010, Genome-wide transcriptome analysis of two maize inbred lines under drought stress, Plant Mol. Biol., 72: 407-423
http://dx.doi.org/10.1007/s11103-009-9579-6


. PDF(256KB)
. FPDF(win)
. HTML
. Online fPDF
Associated material
. Readers' comments
Other articles by authors
. Imran Javed
. Shahid Awan
. Hafiz Ahmad
. Aurangzeb Rao.
Related articles
. Wheat
. Double Haploid
. Cluster analyses
. Morphological traits
Tools
. Email to a friend
. Post a comment